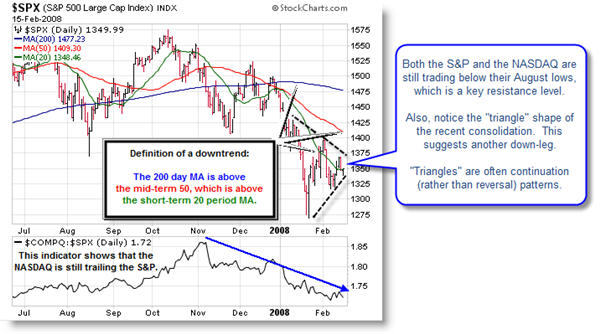
The Markets may still have some room to downside. Basic chart reading says it is bearish when the 200 day moving average is higher than the 50, which in turn is higher than the 20. That is math-speak for "we are in a bearish down-swing." The S&P closed at its 20-day moving average.
Notice also that the NASDAQ/S&P 500 ratio (the indicator below the main chart, shown above) has been falling since early November. That line would have to start rising for the Nasdaq to begin to show some market leadership. Right now, it’s still leading to the downside.
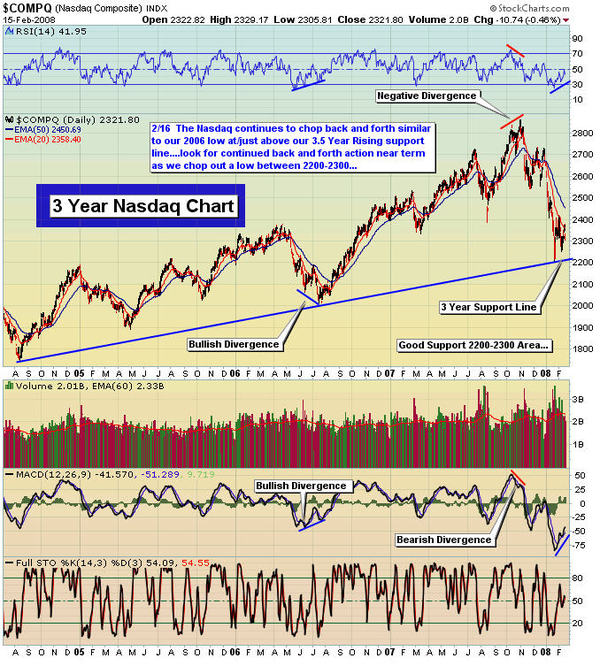
However, the NASDAQ is approaching its rising three-year trendline, so we could see a bottom soon.

This chart is from www.theinformedtrader.com.

