This week had everything: gaps, market-moving comments and whipsaws. The Russell 2000 was down 3.8%, and the other US Equity Indices didn’t fare much better. But, in my opinion, short-term movements here are simply noise.
Clearly the Markets are in short-term oversold conditions and toying with Support Levels. Still, the CBOE’s Equity Put/Call Ratio hit the highest reading seen since February 2003. According to SentimenTrader readings like this often precede major intermediate-term lows in the market.
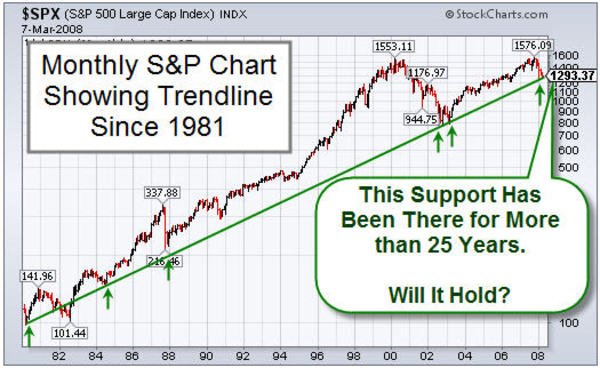
Longer-term charts might provide better context. Markets sank to 18-month lows on heavy selling. The S&P 500 Index closed at its lowest level of the year and is very close to breaking through support. In the chart below, the green line marks the trendline support since the year 1981.
As an aside, do you really think a trendline with so few touches since 1981 is really a market mover? It’s possible that it "describes" what happened better than it "predicts" or "affects" what happens next.
The other major indexes also are sitting just above critical support areas. This will be an interesting week. Don’t be surprised if prices shoot through a widely-watched technical level, only to reverse and head back the other way.
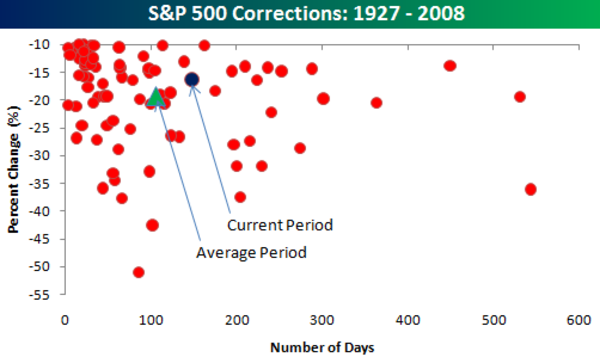
For a little extra credit, I saw an interesting chart on Bespoke’s site. It shows all S&P 500 corrections of 10% or more since 1927. Each point on the scatter chart below represents the percent of the decline along with the number of days it lasted. So how does the current correction stack-up? Compared to historical corrections of 10% or more, while the current period has been longer than average, the declines have so far been milder.


