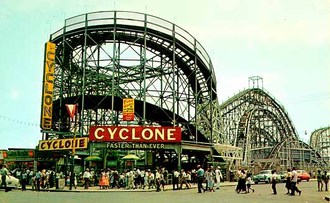
"Six 180-degree turns. Twelve drops. Sixteen changes of direction. Twenty-seven elevation changes. Those stats describe Coney Island’s famous vertigo-inducing Cyclone roller coaster. But it could just as easily describe the hair-raising ride that Wall Street investors have been on this year."
I don’t normally turn to USAToday for trading information, but they had a clever piece, with some interesting market stats, worth sharing.
Q1 brought some pretty frightening results.
- According to The Economist,
the American market was down 9.9%, Europe dropped 9.2%, the MSCI World index was down 9.5%, and emerging markets lost 11.3%; - March was the 5th month in a row
that the S&P declined. - Bespoke reports that the average stock in the S&P 500 is down 31 % from it’s 52-week high;
- employers cut jobs for the third month in a row, as unempolyment becomes a bigger problem; and
- the Government announced it was undertaking a sweeping overhaul of the country’s financial system.
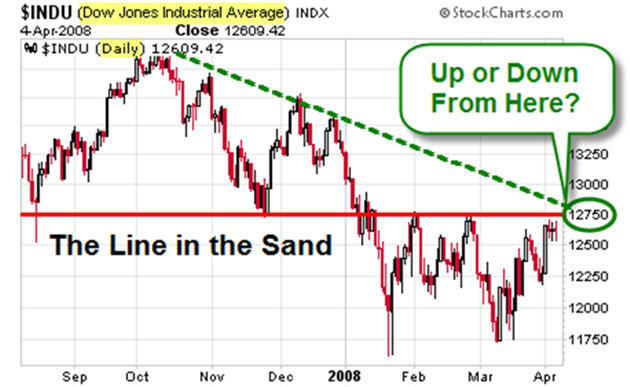
The next chart is a simple daily view of the Dow. Despite recent events, it shows that we’re back up to resistance again. 
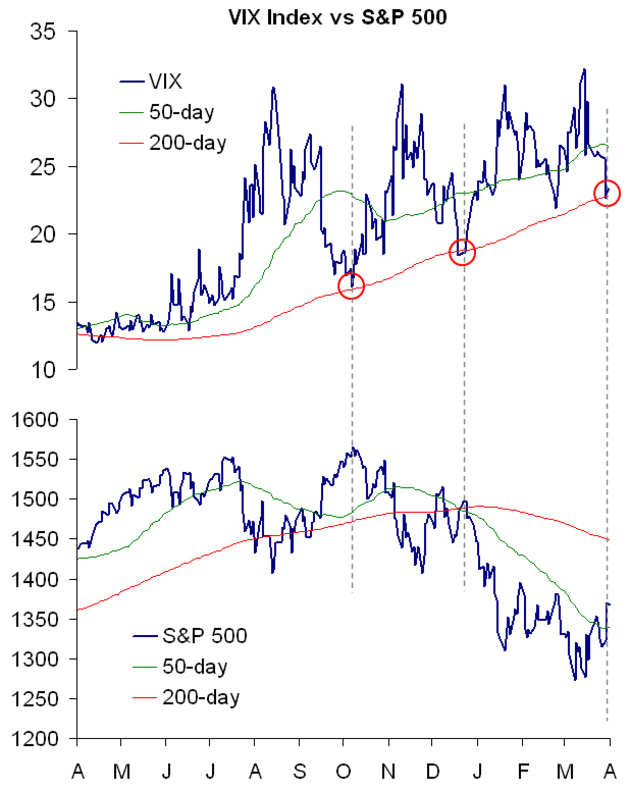
Only, this time, the VIX is showing
very little investor fear – and that scares
me. Tickersense had this chart.

However, since this comes so soon after mass panic, "lack of fear" may actually be
a sign of strength. That’s kind of funny, a contrary indication of a contrary indicator. Even Freud admits that sometimes a "cigar is just a cigar" … So why is it so hard to interpret subsiding fear and rising prices as a positive?

