Here are a few charts that caught my eye. The first is from the
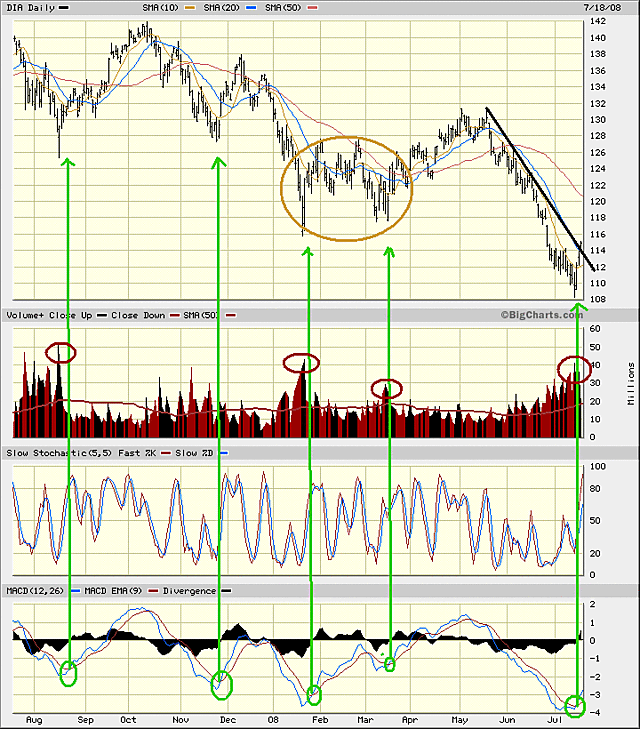
Trading Godess site. It is from a post called, “Did someone ring a bell.” It shows
that a break above the downtrend, on volume, with MACD turning up. In
other words, it has the makings of a decent long set-up.
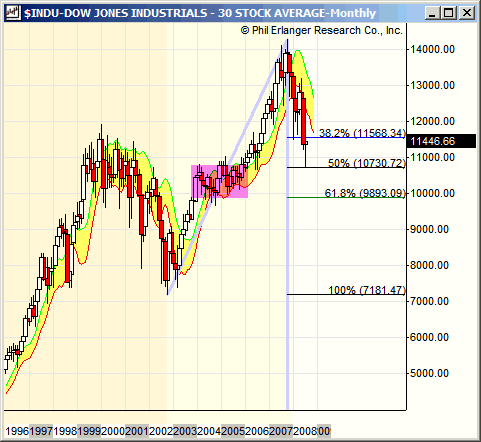
On the other hand Phil Erlanger had this chart, which shows that
the Dow has re-traced 50% of the move off its 2003 lows, but that it
might have a little more to go.


Thank you for the mention. It is appreciated!
🙂