
The market is strong right now. How do I know? Aside from the near-audible moan of bears, Price going up is a pretty good primary indicator.
Kidding aside, other indicators are worth looking at here too. One of them is the NYSE High-Low line.
The following chart shows this market breadth indicator. It is calculated at the end of each day by taking the number of NYSE stocks making New 52-week Highs and subtracting the number of stocks making New 52-week Lows. What is important to notice is the shape of the line – up is strong (or bullish), down is weak (or bearish). Sometimes a picture is worth a thousand words.

You can view updated versions of this chart anytime on StockCharts.com at this link. For some context, after clicking the link, scroll down to see the weekly version of that chart. For additional context, this link will show you what it looked like last November.
Our Rally Isn't Just Our Rally.
Below are a series of iPhone screen captures showing the daily performance of World Equity Market Indices from Bloomberg. The thing to notice is that while the news media in America made a big deal about the market being up because of positive news in the housing market … a quick glance around the world showed equal or bigger gains. This type high correlation continues to attract my attention.

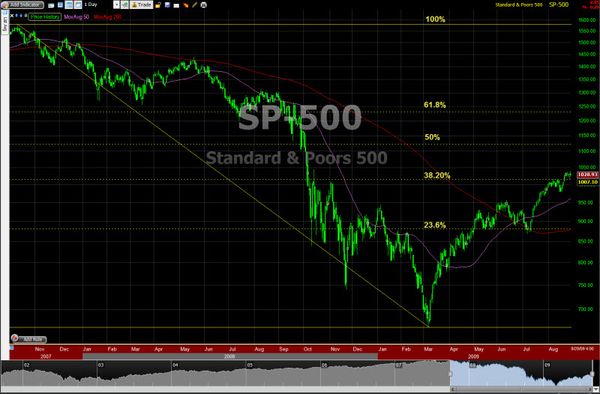
How Far Have We Come?
Here is a chart showing Fibonacci retracement lines drawn from the high back in late 2007 to the low in November of 2009. We are barely back to the second major retracement level … and still a considerable distance from the 50% mark.
There is art and science involved in drawing Fibonacci retracements and extensions. For example, where do you start and end? Would it be better to have started from the highs in May or September of 2008 instead? Click here for more Fibonacci Commentary.
Early Warning Signs?
Here are a few signs that the rally is getting a little worn-out. There has been more volatility lately, and that can be a bearish early indication. For the past few months markets have gone up, even on bad news (like the recent bank closings); however, this past week saw the first hints of markets selling-off after good news. And we are coming into September, which is historically a week month for markets.
The trend is your friend, until it turns.
A Little Humor.
Thought this cartoon about the Cash-for-Clunkers program ending was worth posting.

Business Posts Moving the Markets that I Found Interesting This Week:
- U.S. M&A Sinks to 15-Year Low. (Reuters)
- Surge of Filings Signal Busy Fall for IPOs. (Reuters)
- The Investment Mistakes We Make & Why We Make Them. (WSJ)
- Credit Card Issuers Cutting Lending Limits. (Reuters)
- AT&T and Apple Admit To Limiting VoIP Apps. (MediaPost)
- More Posts Moving the Markets.
Lighter Ideas and Fun Links that I Found Interesting This Week
- After a 30-Year Run, Rise of the Super-Rich Hits a Wall. (NYTimes)
- NPR Offers New Type of iPhone News App. (Mashable)
- 8-Bit Trip, Nintendo-Inspired Stop-Motion Video. (eGuiders)
- The Evolution of Retweeting. (Technology Review)
- Know What You Don't Know: The Mindset of a Problem-Finder. (Wharton)
- More Posts with Lighter Ideas and Fun Links.