 It is good to get a fresh perspective on the markets.
I spent some time with Carolyn Boroden this week. I've been following her work for the past six or seven years. She has an interesting trading style, using Fibonacci retracements and extensions as well as market symmetry. Here is some of what she shared.
Carolyn measures various market swings, and projects likely areas of support and resistance based on where these retracement and extension levels overlap most frequently. By taking readings from various swings sizes, she is effectively incorporating multiple time frames and trading styles in her analysis.
She is a frequent speaker at industry events, and she has a website and live trading room where she provides market commentary.
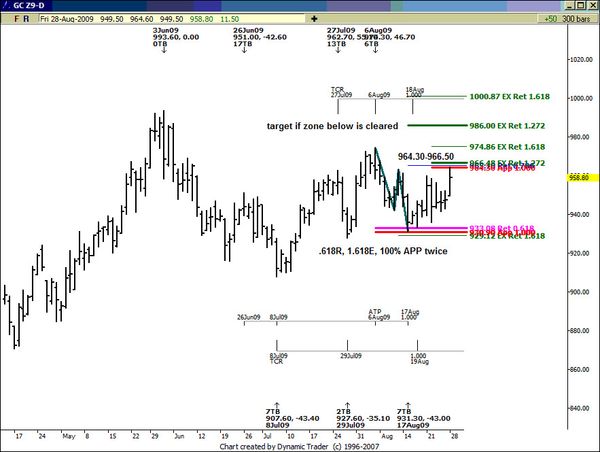
Here is an example of her work on a daily chart of the Gold Market.

Here's what she says about that chart. Click here to watch a video she made of the analysis.
The low in this chart was made at the confluence of a .618 retracement, 1.618 extensions and two 100% price projections (Alternate price projections or APP's on chart) Now we are at a decision on the way up….to fail or not to fail….If this area of resistance is cleared…the initial upside target for gold is at the 986 area….If we fail at the listed resistance…it's a low risk sale…
Further Info:
- Here is a link to her website: Fibonacci Queen.
- Here is a link to her book: Fibonacci Trading: How to Master the Time and Price Advantage
 .
. - Here is a link to a video she did about Fibonacci Clusters.
- Click Here To Follow Carolyn on Twitter.
