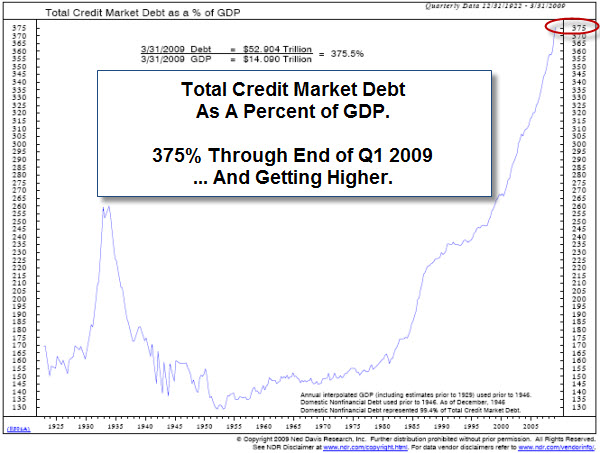
Our credit market debt is approximately 375% of our Gross Domestic Product. That caught my attention; it shows how much more burden the economy carries now than it did during the Great Depression. The unemployment situation adds to that burden.
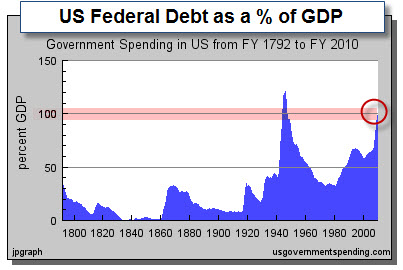
If that isn't frightening enough, the next chart gives a slightly different perspective. It helps visualize the cost of the government's massive action and stimulus. Consequently, we are staring at the largest estimated budget deficit as a percentage of nominal GDP since World War II. It wouldn't surprise me if the projected $1.84 trillion deficit for fiscal 2009 should soon prove to be a conservative estimate, and it moves above $2 Trillion. Here is a recently updated chart of Federal Spending.
For more on this, here is a link to some interesting commentary from TCW Group. The Great Debt Binge: A Tragedy in Three Acts. And this link from Crestmont Research has a different perspective.
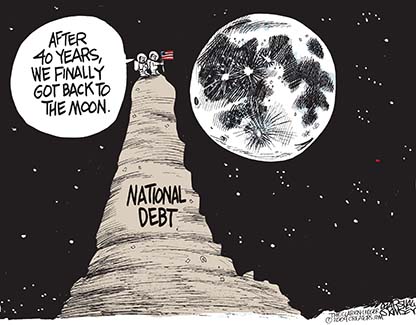
Another Way For NASA to Get Back to the Moon.
There is talk that budget woes may hurt NASA's plans to get back to the moon. Perhaps there is another way …
Current Market Commentary.
Speaking of rocket rides, once again the markets held up well, even after a worse-than-expected jobs data report shows the highest level of unemployment since 1983. The equity markets have surprised many by consistently fighting off worries that they have climbed higher than economic fundamentals warrant. However with September being a notoriously bad month, historically, for stocks … Concerns are high that a correction is likely as trading volume increases after the holiday weekend.
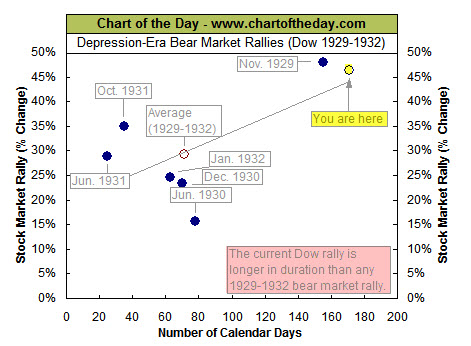
How Does This Rally Compare to the Great Depression Bear Rallies?
For some perspective on the current stock market rally and how it compares the 1929-1932 bear market, this chart illustrates the duration (calendar days) and magnitude (percent gain) of significant Dow rallies that occurred during the 1929-1932 bear market (solid blue dots). For example, the bear market rally that began in November 1929 lasted 155 calendar days and resulted in a gain of 48%. As this chart illustrates, the duration of the current Dow rally (in yellow highlight) is longer than any that occurred during the 1929-1932 bear market. As for magnitude, only the November 1929 bear market rally resulted in a better performance than what has occurred during the current rally to date.
Many of the analysts I follow are starting to lighten-up their long exposure. For example, Doug Kass called the top a week ago. Likewise, Art Cashin said he is selling stock and taking some risk off the table.
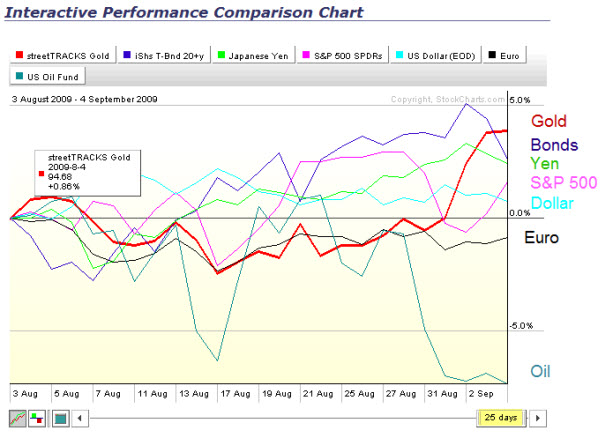
If you were limited to "going-long" equity indices, then there would be a lot to worry about. Instead, this situation creates other opportunities. Let's look at some of them. StockCharts.com is a good source for a bigger picture. The next chart shows how some of the these intermarket trade opportunities have done over the past month or so (like Gold, Bonds, Yen, US Dollar, Euro, and of course the S&P 500).
I was looking for Gold to break-out; however, I wasn't aware that other defensive plays, like Bonds or the Yen, have been doing so well recently.
By the way, the chart above is interactive; so by clicking the picture, you can drag the yellow-highlighted date range slider to see how the change plays-out over time. You can also add or change the markets this comparison uses.
Business Posts Moving the Markets that I Found Interesting This Week:
- Arrest Over Software Illuminates Wall Street Secret. (NYTimes)
- Fed Minutes Show It Expects Slow Growth Ahead. (NYTimes)
- Is China's Stockmarket an Indicator of Where Ours Is Going (Economist)
- China Begins to Open-Up to Private Equity. (WSJ)
- India's High-Flying Bank Stocks 130%+ from its March Lows. (WSJ)
- Six Months In: How Successful is the President's Leadership Style? (Wharton)
- More Posts Moving the Markets.
Lighter Ideas and Fun Links that I Found Interesting This Week
- EBay Gives Up Control of Skype to Private Investors. (NYTimes)
- Brazilian ID Thieves Using Twitter as BotNet Command Channel. (ZDNet)
- Amazon Web Services Rolls-Out Virtual Private Cloud for the Enterprise. (ZDNet)
- New iPhone App Uses Virtualization to Deliver Computer Desktops. (Forbes)
- How Long Does It Take to Build a Technology Empire? (WSJ)
- More Posts with Lighter Ideas and Fun Links.

Good post. Worry we should, about debt (both consumer and government) service, and historic (read: conservative) ratio’s. What is hard to plot is the timing. We all got blown out over the last 18 months and agree the gov’t is propping this up, but sitting out the ride doesn’t repair the capital damage. Frankly, I’ve been selling for the last 30 days, albeit slowly…