The Trend Is Up; So Discipline Says Buy the Dip.
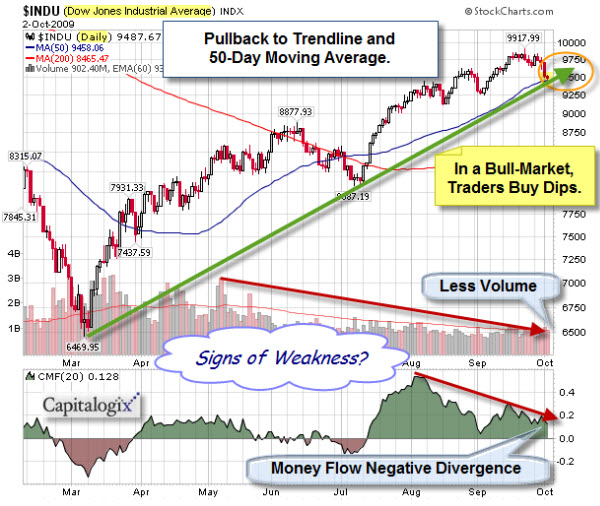
Most of the U.S. Equity Indices (Dow, S&P 500, Russell 2000 and the MidCap Index) have pulled-back to their 50-Day moving averages and short-term support. So have many sectors, including: Financials, Metals, Energy, Drugs, Materials, and Consumer Discretionary. This would be a likely place for bulls, looking for a continued rally, to put some extra cash to work in the markets by buying the dip.
Tech is still leading the rally. So I'm watching that area closely for continued strength. A lack of buying here is a warning sign.
The Market Is Getting Jiggy.
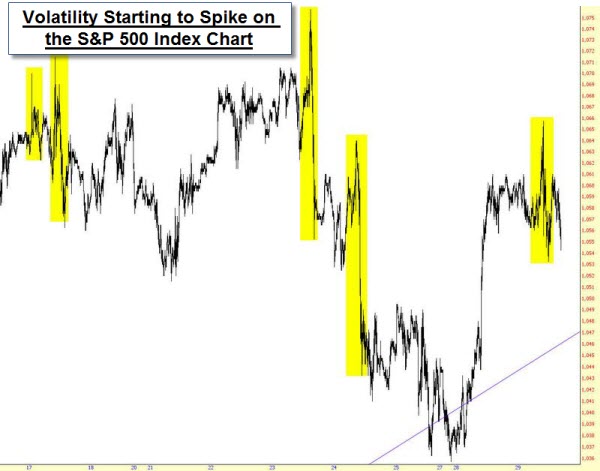
One thing tempering my confidence in the "buy the dip" strategy is that I noticed a lot more "mischief-bars" recently. These head-fake moves show-up on charts as jaggy spikes, and often shake-out weak holders … only to reverse sharply. Here is a chart of the S&P 500 from Tim Knight's Slope of Hope site. The yellow sections highlight areas where it is easy to see the spikes in volatility.
This type of behavior often happens near major trend changes, and reflects the disagreement between bulls and bears.
Does the Recent Weekly Buying Climax Signal Exhaustion?
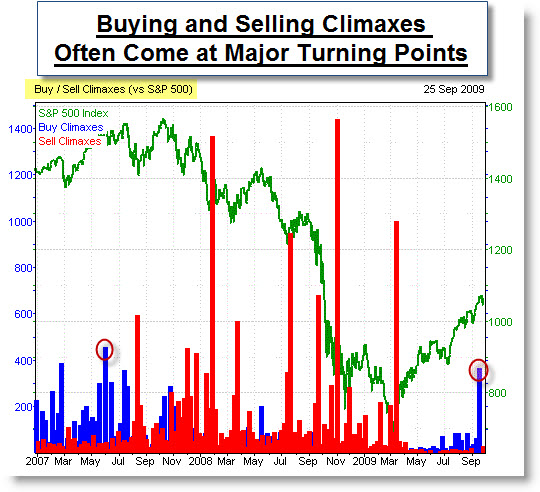
For those looking for further evidence of a turning point, Investors Intelligence recently released a chart showing major buy and sell climaxes in the S&P 500. As you can see, they often come at major turning points for the markets. The Blue Bars show Weekly Buying Climaxes, which occur when a stock makes a 52-week high and
then closes lower for the week. This represents distribution from strong
hands to weak ones and most often occur around market highs. And the Red Bars mark Weekly Selling Climaxes, which occur when a stock makes a 52-week low and
then closes higher for the week. This represents distribution from weak
hands to strong ones and most often occur around market lows.
This chart shows that there were 380 total Weekly Buying Climaxes as of the end of last week (see the blue bar at the bottom right of the chart). This was the highest buying total since June 2007 (which is the blue bar circled in red, towards the bottom left of the chart) and eclipses the extreme reached at the October 2007 top. Investors Intelligence notes, that after four months, climax signals for those who sell into buying climaxes and buy into selling climaxes are correct about 80 percent of the time. So another indicator has flashed a “warning” that suggests we be especially attentive to a trend change.
Employment Numbers.
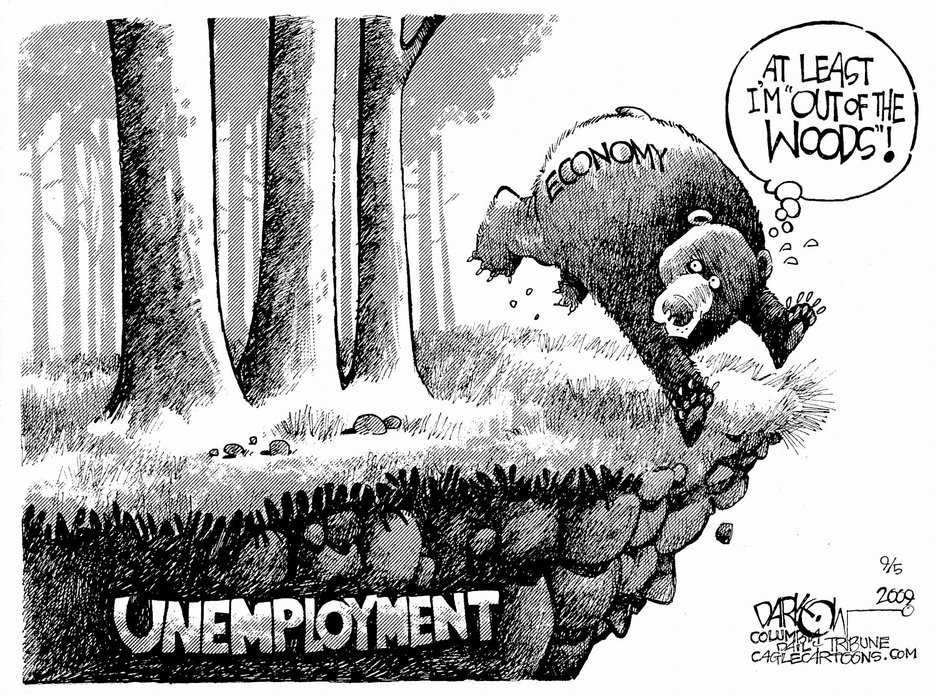
Of course the other thing weighing down the hopes of economic recovery is unemployment. The numbers haven't been improving. Moreover, I expect to start hearing about the next wave of big cuts (that cut muscle, and not just corporate fat). Recent quarterly results showing corporate profits were often based on cost-cutting, which may not be sustainable. Revenue is a more telling indicator.
This is something that bears watching. The next topic bears watching too.
All You Need to Know About High Frequency Trading.
Here is a short video from the Jon Stewart Show. It portrays High-Frequency Trading in a less than flattering light. It was funny; yet made some non-trivial points.
| The Daily Show With Jon Stewart | Mon – Thurs 11p / 10c | |||
| Cash Cow – High-Frequency Trading | ||||
|
||||
Ultimately I believe that innovation and intelligence can lead to competitive advantage. And, generally, that is a good thing. However, even a good thing can be taken too far. This is an area that needs some common-sense legislation and oversight. High Frequency Trading makes it too easy to manipulate price and markets.
Business Posts Moving the Markets that I Found Interesting This Week:
- S&P Says Stock Buybacks At Lowest Level On Record. (StreetInsider)
- Is Wall Street Taking a Chance on Risk, Again. (DealBook)
- Fretful Investors Sidelined by Rally. (WSJ)
- Kass – Pokes Some Fun at the "Dumb Money" Behind the Rally. (TheStreet)
- More Than Half of Residential Mortgages Made by Just 3 Large Banks. (WSJ)
- If Lehman Hadn't Failed, Would the Crisis Have Happened Anyway? (Economist)
- More Posts Moving the Markets.
Lighter Ideas and Fun Links that I Found Interesting This Week
- Did Kindle edition of Dan Brown's 'Lost Symbol' Out-Sell Hardcover Editions? (WSJ)
- The "Lost Symbol" Shines Spotlight on Freemasons in Washington. (USNews)
- Leading Research Universities Launch Futurity Online Research Portal. (Duke)
- Simplifying Supplements: Modern Diet is Energy Rich, Yet Nutrient Poor. (Ode)
- Four Things that May Sabotage Your Weight-Loss (USNews)
- Business Intelligence Gives Way to Operational Intelligence. (Forbes)
- More Posts with Lighter Ideas and Fun Links.


