
The best thing I can say about the market is that the current lack of sellers is giving investors a good long chance to take their bullish bets off the table.
Unemployment is above 10%, and at its highest level since 1983. Here are a few economic signs.

What about the Market?
The chart below shows an upwards sloping trend channel on a chart of the S&P 500 Index.
- Notice that the early part of the up-trend stayed above the channel's mid-line (indicated by the blue solid line); and
- Notice the second half of the up-move stayed above the bottom portion of the channel (indicated by the green solid line) until recently;
- Also notice that the market is recently rebounded to test the underside of this line. I highlighted that portion with an orange circle. This chart pattern is often called "kiss and say goodbye" because a failure to jump back above the lower trendline, back into the upward sloping channel, is often a sign seen at market tops.
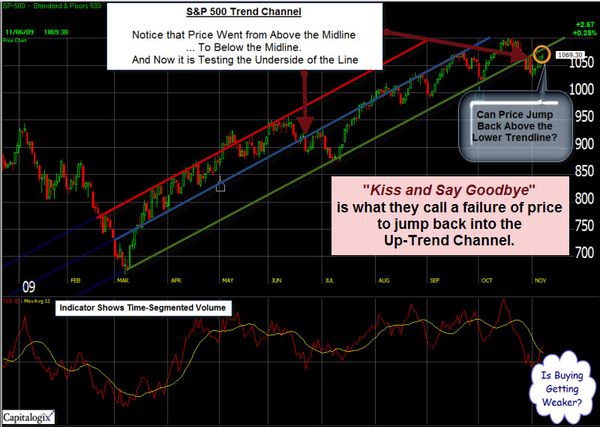
On the other hand, jumping back into the upward sloping channel would be a bullish sign.
Bob Prechter Calls a Major Top Using the Elliott Wave Pattern.
If you are looking for Top-Calls, then Bob Prechter is not shy. He says: "Stocks are topping out, commodities are topping out and the dollar is making a bottom".
Prechter is a high profile market commentator who uses Elliott Wave as a framework for understanding the market. So, I thought this might be an interesting time to re-visit this technique.
The premise is that the market doesn't affect sentiment. Rather, it is the other way around; collective sentiment affects the market. And that while markets change, human nature doesn't … consequently, predictable patterns play out over and over again. Prechter calls this "Socionomics".
While I now look at Elliott Wave more as a way of understanding what the market has done (rather than a great predictor of what it will do next), I do believe it is helpful in getting a sense of the next likely swing.
Here is a chart that shows the basic sequence and an example of the sentiment causing the move.

The next chart shows that a similar sequence often happens in both directions.

All this reminded me that I have a piece of software called the Advanced GET, which uses a pretty clever algorithm for identifying some of the simpler Gann and Elliott Wave trading patterns. So I dusted-it-off, fired-it-up, and started playing around.
Looking at a weekly chart of the Russell 2000 Index, it's very easy to envision
a five wave sequence as follows.
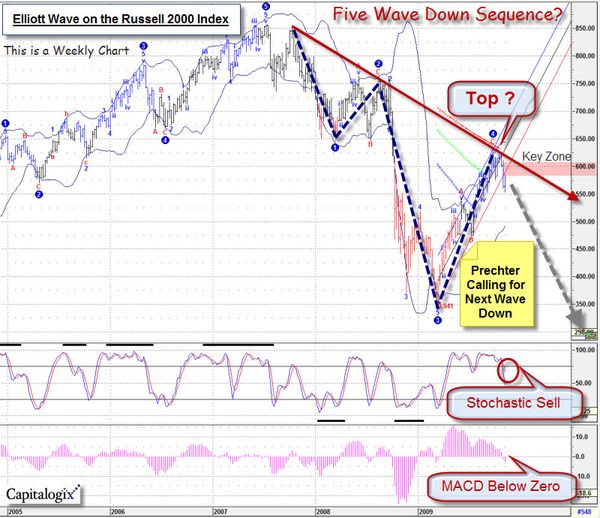
Note that the wave five target
is beneath the recent bear market lows. And that the wave four pullback takes us back to the top of the downwards sloping trendline … and seems to have pretty clean Elliott Wave size,
slope, and timing.
Again, I don't trade
the Elliott Wave. Yet it fascinates me, and is something
that I do pay attention to as a framework. Add to all this that the daily chart of many US equity indices are stalled at their 50-day moving averages and kissing the bottom of their recently broken up-trendlines, and I'm certainly going to be wary of a pull-back here.
Business Posts Moving the Markets that I Found Interesting This Week:
- Does Economics Violate the Laws of Physics? (ScientificAmerican)
- Fed Tests Tool For Reeling-In Money From Economy. (Yahoo Finance)
- Time for Companies to Justify Big Gains. (WSJ)
- How We Got Here: Bush Advisor Analyzes the Financial Sector Meltdown. (WP Carey)
- Smaller, Faster, Cheaper – The Enterprise Is Changing. (Forbes)
- Is the Dollar Losing Its Status as the World's Reserve Currency? (WSJ)
- More Posts Moving the Markets.
Lighter Ideas and Fun Links that I Found Interesting This Week
- Apple is the Outlier in this Recession. (Forbes)
- The Mortal Sins Of Chart Design, and How to Fix Them. (BusinessInsider)
- Will Airports Screen for Body Signals Instead of Bombs? (CNN)
- Can Men Breastfeed? Apparently, They Can. (MentalFloss)
- Why Some Sleep Better Than Others (Forbes)
- Are You Asleep? Exploring The Mind's Twilight Zone. (NewScientist)
- More Posts with Lighter Ideas and Fun Links.