
It looks like the economy is taking off. Of course, a jobless recovery would weigh things down.

We saw more favorable (or at least less negative) jobs report this week. We'll see if this marks a turning point for this important measure. In any event, the Markets have continued to hold up well.
The Big Picture.
Here is a three-year look at the NASDAQ Composite Index. The good news is that price broke above the blue-dashed trend-line, and has been able to hold its position and make new highs. That was bullish. Traders notice that momentum is slowing, and that price is mired in a key resistance zone. This area (marked in pink) is seen as a support-and-resistance zone and also marks the 61.8% retracement level (which traders often look at a reversal trigger).

Consequently, a sustained move above this cluster of resistance would be bullish for the market.
Let's Zoom-In for a Closer Look.
As noted, though, upwards momentum has slowed. The next chart is an intra-day chart of the S&P 500 Index. For most of November, you can see trading ranges alternating above and below a "Disagreement Zone" (which is highlighted by the gray zone). Think of this as an arm-wrestling match. Currently, there is no clear winner. Each push in one direction, has been met with an equal push in the opposite direction. In addition, many of the moves are the result of overnight gaps. These are marked by the orange circles. You can click the chart below to see a larger version.
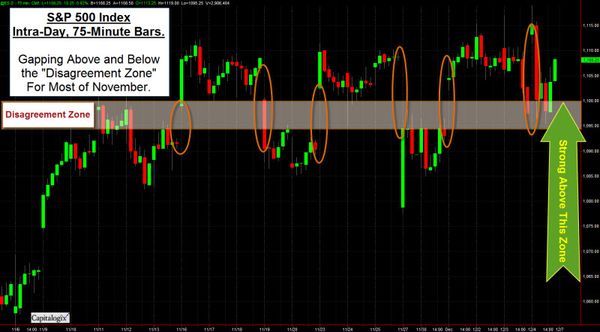
This chart also implies that it would be bullish for the markets to sustain its move above this "Disagreement Zone" level. It is a pretty clear "line-in-the-sand".
Let's Look Under the Surface at Market Breadth.
This chart looks at NSYSE stocks making new 52-week highs, and subtracts the number of NYSE stocks making new 52-week lows . That means we get more Net New Highs when the markets are doing better. As it stands, A lot of NYSE stocks are making highs for the year. Yet, there are less Net New Highs than we saw in October. While this is a little picky, it does constitute a negative divergence. Consequently, I'm watching what happen in this measure as a potential early indicator of market change.

Hope you have a good week.
Business Posts Moving the Markets that I Found Interesting This Week:
- Respecting the Recovery: Do the Pouting Pundits of Pessimism have it Wrong? (Forbes)
- Too Big to Ignore: Unease Over Banks' $1 Trillion of Cash Reserves. (WSJ)
- Roubini: A Tale of Two American Economies. (RGE Monitor)
- M&A Is Back — But This Time, It's Different. (Wharton)
- Shoppers Are Winning at Chicken, Waiting for Discounts. (WSJ)
- More Posts Moving the Markets.
Lighter Ideas and Fun Links that I Found Interesting This Week
- Sinnovation: The Seven Deadly Sins of the Innovator. (BusinessWeek)
- Balancing Urgency & Patience to Get Best Business Results. (Forbes)
- Why Do We Yawn? Theories Abound. (Telegraph)
- Research Shows 40% Bare Is How Women Best Attract Men. (Newser)
- TIME 100 Roundtables – Talking About The Future of Technology. (Time)
- More Posts with Lighter Ideas and Fun Links.