Last week several news items caught my eye as potential "sign-of-the-times" indicators. With markets still near recovery highs, the amount of fear and loathing is surprising. Here are some examples.
- Bernanke's 2nd term confirmation ran into opposition. The magazine cover curse strikes again.
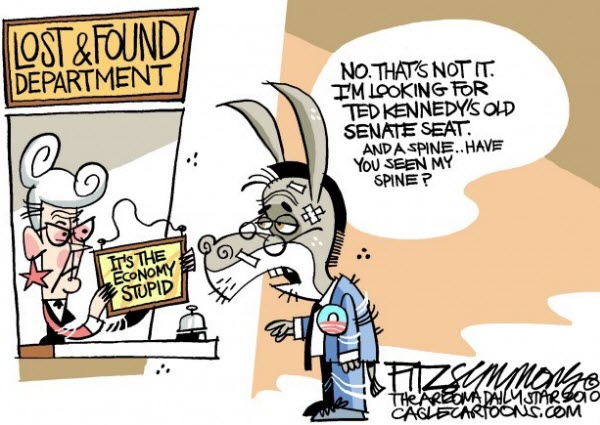
- Kennedy's Senate seat went to a Republican.This was not the change Dems hoped for.
- Harley-Davidson posted its first loss in 16 years. Also,
- Google was down even though its profit quintupled. Selling good news is bearish in my book.
Let's Look at the Market.
For
a number of weeks, the rally was holding-up even though there were a
number of signs indicating underlying weakness. That means buyers
bought the dip.
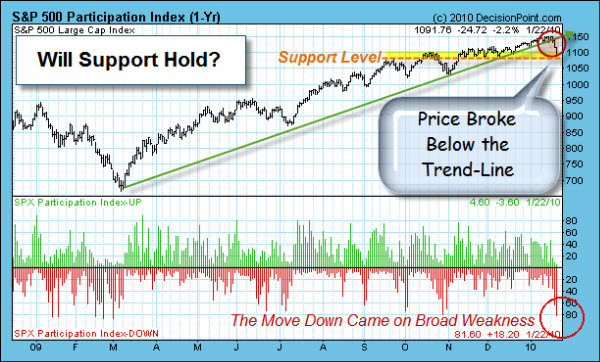
Well, last week price finally broke beneath the trend-line from the
March lows. It is a bearish sign, unless price can get back above the
trend-line quickly.
Currently,
price is still above the support level marked by the orange
dashed-line. A move beneath this level would be another bearish sign.
The next question is whether the move will find the selling power that has been so noticeably absent during the rally?
Perhaps A Little Bit of Fear Will Be a Good Thing for Trading Volume.
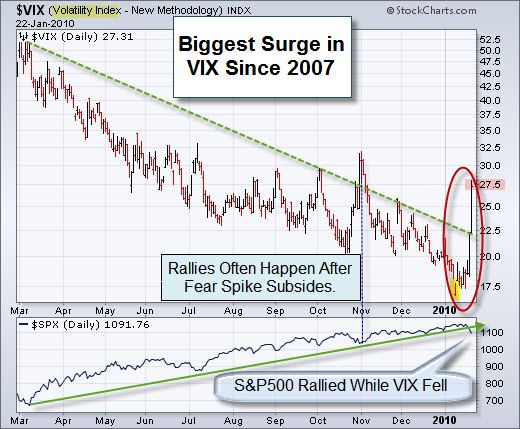
The CBOE Volatility Index (VIX), often thought of as the market's fear gauge, capped its biggest three-day run-up since February 2007. Recently (until last week) it was more of a complacency gauge. Here is a chart showing the steady decline, and then the surge.
So, short-term, we'll see if that shakes-out some Bulls who are questioning their conviction.
Rembember, however, that market rallies often happen after a fear spike subsides. So if we don't get selling volume, the next question is whether Bulls will buy the dip?
At this point I am watching the VIX, because while the spike of fear was big … it came when the VIX was at an extended low. Fear and Greed (or Bears and Bulls) collide, here, as a result of the conflict between the short and longer term views of the market. Which side wins will likely have big consequences, because a move higher in the VIX will likely coincide with a bigger move down in the markets.
The U.S. Dollar might also provide some clues to market direction. The Dollar and equity markets often move opposite each other. Currency speculators increased bets against the Dollar in the latest week, according to Commodity Futures Trading Commission data released on Friday. The value of net short positions in the dollar rose to $3.12 billion in the week ending Jan. 19, from a net short position of $2.7 billion the previous week, according to Reuters calculations.
The Markets Are Oversold in the Short-Term.
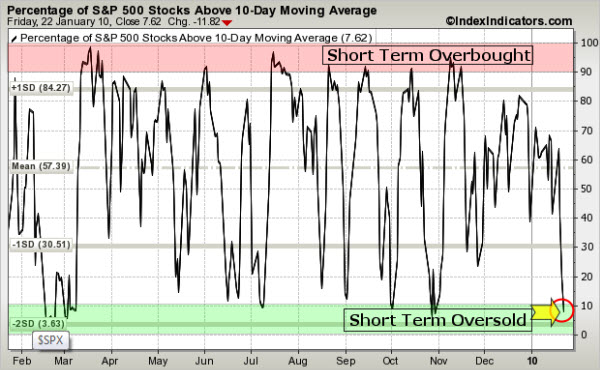
This chart shows the percent of stocks in the S&P 500 Index that are trading above their 10-day moving average (in other words, what percent are in an up-trend on a short-term basis?). Right now, less than 10% are.
As you can see, we don't get extreme readings like this often … and when we do, the market tends to bounce. To see an interactive version of this chart with an overlay of the S&P 500 Index (so you can see how often the overbought and oversold readings work) click here.
Business Posts Moving the Markets that I Found Interesting This Week:
- Obama Takes the Fight to Rein-in Big Finance on Wall St. (WSJ & TDB)
- Goldman Earned $4.95B in Q4 – That's Almost Real Money. (NYTimes)
- Bernanke's Burn Notice: From Man-of-the-Year to Scapegoat. (NYTimes & EWave)
- Op-Ed Piece: Obama's Power-Outage On the Edge of the Abyss. (TDB & Newser)
- Surprise, Everyone at the Barron's Roundtable is a Bull. (Business Insider)
- More Posts Moving the Markets.
Lighter Ideas and Fun Links that I Found Interesting This Week
- Can Strategic Alliances Help Us Innovate Our Way Out Of Recession? (Forbes)
- The Rise of Machine-Written Journalism. (Wired)
- One Step Closer to the Jetsons: Skype In Your TV. (NYTimes)
- Netflix Expects to be Mailing DVDs for Another 20 Years. (Business Insider)
- Bacteria Offer Insights Into Human Decision Making. (PhysOrg)
- More Posts with Lighter Ideas and Fun Links.


