
It's time to talk about American Idol (with the Finale this week, and all).
Sorry, my mistake … another bad jobs numbers came out & the markets went down … so it is time to talk about the American Idle.

Last week was rough for the bulls; and if not for a reversal after the opening bell on Friday, it would have been a lot worse. Consider this: The Russell 2000 gained 2.5% after the open on Friday and still finished with a 6.44% loss for the week. So, yes, it could have been a lot worse.
Was That a Key Reversal Day in the Markets Last Friday?
The S&P Index 500 technically complied with all the rules of a "key reversal day." It plunged to a new low of a significant decline. It then rallied up on increasing volume, and closed well above the prior close.

And here is a longer-term chart showing the S&P on a weekly basis.
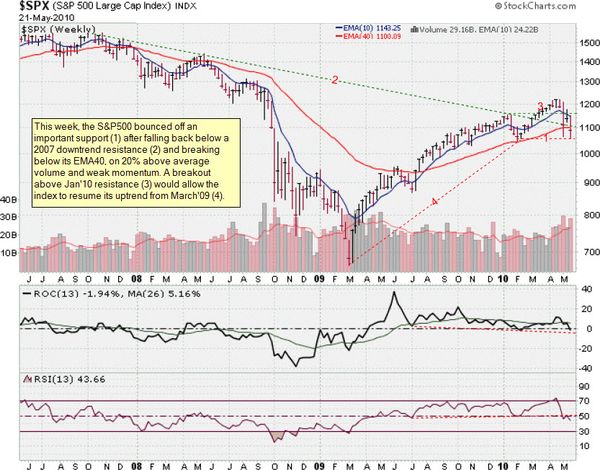
We will see if there is some buying triggered here. If the bull-market swing is to continue it has to kick-in soon.
But Where Is the Selling Pressure?
With the market in a dizzying decline, why haven't we seen more committed bearish bets? Are traders going flat instead of short?
One reason is discussed by Carl Swenlin. His assumption is that bull market declines will be short-lived, and that a neutral signal eliminates market exposure during a correction, while at the same time addressing the lower probability outcome of a full bear market decline. In other words, we never know if a bull market correction will actually be the beginning of a new bear market, but we do know that most of the time it won't be, so it makes sense to bet with the odds and go neutral.
A Dash of Insight.
I saw a list that I wanted to share. It from the Dash
of Insight blog, which is a consistently good source of information. Here is an excerpt.
"I am pretty fussy about economic news related to jobs and housing, and I did not like what I saw.
- I closely watch building permits as the best leading indicator of new construction. Construction is up (reflecting the tax credit, which has now expired) but building permits were down 11.5%.
- The BLS report on Business Dynamics showed job losses for the quarter ending in Sept., 2009, were about 300K worse than expected. You will not see this news anywhere else. Even though this is an "old" report, people should watch it as a way of verifying the accuracy of the "official" BLS payroll employment report projections. Basically, this is an early read on eventual "benchmark" revisions. There was plenty of job creation, including a million jobs from new establishments, but still not as much as estimated. More detail is beyond the scope of this weekly summary, but those interested can get the essentials of the argument in my analysis of the November report (different time, same issue).
- The uptick in initial claims was also a negative for jobs. We really need to see progress on reduced layoffs and more job creation. Both seem to have stalled.
- The S&P 500 broke the 200-day moving average. Many people view this as the most important technical indicator, keeping them on the right side of major trends. This is being quoted as 1102 or so, and is something to watch.
- The ECRI indicators are in the growth area, but weaker than in past weeks. Their interpretation? "With WLI growth sinking further to a 43-week low, U.S. economic growth is set to start easing in fairly short order." This seems to be an unusually strong emphasis on a "second derivative" interpretation of a strong reading, but it is their index. I look at their numbers, but also at their own interpretation.
The high volatility in trading is frightening to nearly all investors. Thursday was especially bad. The extremely late rally on options expiration day makes the week's pricing look a bit better, but most observers will need much more convincing."
VIX Approaches Pre-2008 Record Highs
The Volatility Index is spiking.

When the VIX rises as it's done the past two weeks, emotions rule the market.
Bill Luby found that, prior to 2008, the VIX only managed to nudge its way over a reading of 45 on three instances:
- the Long-Term Capital Management crisis;
- the Russian Financial Crisis that preceded the LTCM debacle; and
- the height of the dotcom crash, when WorldCom filed for bankruptcy.
The table below summarizes the top ten pre-2008 VIX closing highs. Last week’s VIX spike to 45.21 would put it at #3 all-time outside of the 2008 financial crisis.

Will fear subside, or will volatility continue to soar? That will be one of the keys to the market worth watching next week.
Business Posts Moving the
Markets that I Found Interesting This Week:
- How Bankers are Cleverly Gaming the U.S. and Tax-Payers. (Newser)
- Stop the Machines! Save the Dow. (TheStreet)
- Pimco's El-Erian: Could Greece Become a Global Phenomenon? (InvestmentNews)
- Can We Avoid Becoming Europe? (Heritage Foundation)
- Generation Y is Broke: 37% of 18-to-29-Year-Olds are Underemployed. (Newser)
- More Posts
Moving the Markets.
Lighter Ideas and
Fun Links
that I Found Interesting This Week
- Hypnotized by Charisma: An Explanation For "What Was I Thinking". ("The"-ness)
- Craigslist Explains its Seemingly Insane, Yet Successful, Business
Model. (Forbes) - Presidential Panel: Cancer Risks Underestimated for Many Common
Things.
(CNN) - A Cardiologist's Dream: You Can Buy a Bob Evans Sausage Gravy
Machine.
(Gizmodo) - Life After Moore's Law: Taking the Leap Into Parallel Processing.
(Forbes) - More
Posts with Lighter Ideas and Fun Links.
![Reblog this post [with Zemanta]](http://img.zemanta.com/reblog_c.png?x-id=5036bf7d-9b96-4a7e-8c3f-6375a3439d3c)
I concur…The numbers just don’t fit the “self sustaining recovery” story I hear on Bloomberg every day. The technicals now stink too.
It will be interesting to see how the markets react to news in the coming weeks.
Also, lots of countries have equity indices in worse shape than we do. Fear and desperation makes it harder for countries to work in a coordinated fashion.
It is always interesting.