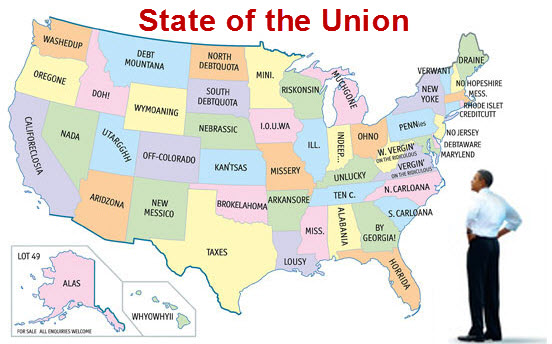
The Economist has a funny map on its cover this week. It shows the troubled state of our Union.

President Obama used different words to describe the State of the Union from his perspective. Here is a Word Cloud.

According to CBS News, President Obama's State of the Union speech included more than 6,500 words, led by variations on "America," "people," "new" and "jobs," with "future," "work" and "years" also high in the word count. While word repetition doesn't offer any deep analysis of the speech, the broad message is clear: "American people need new jobs and work in future years."
Market Commentary
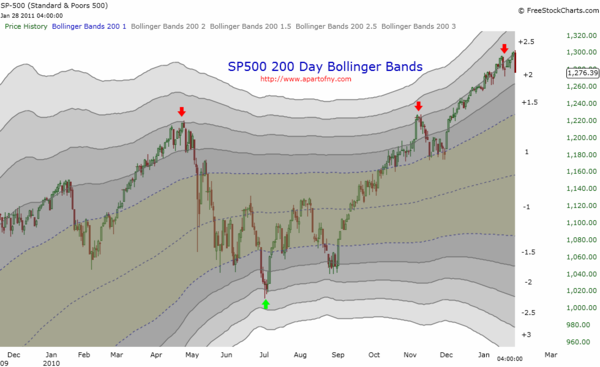
The Markets were ripe for a pull-back. I say that only because the climb higher has seemed un-relenting, in the face of good or bad news. Recently, technical indicators showed some underlying weakness, but price marched forward. Finally, this past week, we saw some selling pressure.
The real question isn't whether buyers will step back in, rather, it is whether sellers will apply some pressure.
Last week we got a GDP number that wasn't great, but it wasn't terrible either. Combine that with the political unrest in Egypt, and some less than stellar earnings reports … and the pull-back seems mild.
The purpose of Bollinger Bands is to provide a relative definition of high and low.
So, What is Jim Rogers' Advice? … One Word: "Commodities".
“If the world economy gets better, commodities are going to make a fortune. If the world economy does not get better, commodities are the place to be because they are going to print more money, and that’s how you protect yourself,” investor Jim Rogers told Larry Kudlow on CNBC.
“This is the time when you should own real assets, not stocks and bonds. Throughout history, go back and look, you know we had huge inflation in the 70s, stocks were not in a good place to be,” he said.
"Given the uncertainties surrounding the global economy, investing in commodities is your safest bet," says Rogers.
From my perspective, I'm watching where smart money asset flows point. There is always something working in the markets. Our job is to find what's working and avoid the rest. Easy, right?
Business Posts Moving the Markets that I Found Interesting This Week:
- Hedge Funds' Pack Behavior Magnifies Market Swings. (WSJ)
- Just Re-Branding? Why Are High-Frequency Traders Getting a New Name. (Forbes)
- The Overconfidence Problem in Forecasting. (NYTimes)
- Twelve Things John Hussman Believes. (HussmanFunds)
- How Bloomberg Gets Earnings Reports Before They're Publicly Released. (BizInsider)
- More Posts Moving the Markets.
Lighter Ideas and Fun Links that I Found Interesting This Week
- Lessons From the World of Aikido (PresentationZen)
- IBM's Watson Jeopardy Supercomputer Beats Humans In Practice. (CNN)
- Infectious Moods – How Bugs Control Your Mind. (NewScientist)
- Top 6 Private Sale Sites for the Best Travel Deals. (Mashable)
- Why Chinese Mothers Are Superior. (WSJ)
- More Posts with Lighter Ideas and Fun Links.


