Another strong week for the markets.
The Wall Street Journal summed it up nicely.
The "risk on/risk off" trade has come roaring back.
Across financial markets, trading patterns more commonly seen in 2010 are returning. Stocks and the dollar are consistently moving in opposite directions, as are stocks and Treasury securities.
It is a trading pattern that was common for much of 2010 as investors swung in and out of markets en masse–buying "risk on" investments like stocks when they felt brave, and "risk off" assets such as Treasurys and the dollar when they wanted safety.
Markets could be at risk of knee-jerk moves for the foreseeable future, a result of the increasingly volatile nature of global markets, and liquidity being pumped into markets by the Federal Reserve.
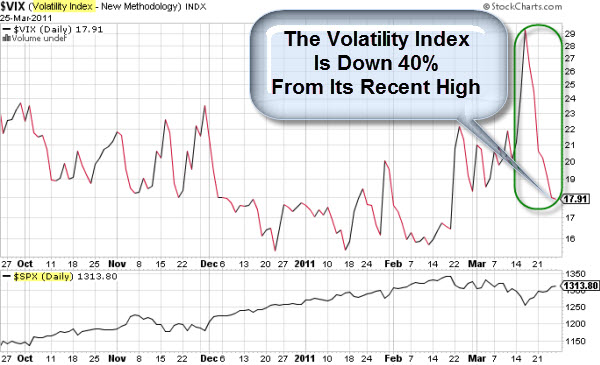
Volatility’s Whipsaw: VIX Falls 40% After Jumping 46%.
The Volatility Index (or VIX) is regarded as the "Fear Index" by many.
So, it is worth noting that the VIX has fallen 40% from its recent highs. It is also worth noting that That the big move down was preceded by a three-day rise in the VIX of more than 46.
According to Barron's, since 1990, the VIX has only experienced a three-day decline of 25% or more that was preceded by a three-day rise of 25% or more eight times.
“During those eight periods, the average and median performance of the S&P 500 has been negative in the days and weeks following these big moves higher and then lower in the VIX”.
We are Seeing a Lot of Big Ups and Big Downs.
One of the bullish signs, recently, has been the market's ability to snap back and continue its push higher despite recent events. Yes, there have been big swings; but instead of 'Fear', order returns … and the market is once again acting like it is relatively undaunted by concerns.
Remember, how much markets move up and down is a different form of volatility. You can measure it in many ways, for example, based on the Average True Range. However, historically, increasing volatility is not a positive sign for the markets (because it suggests indecision, and has often occurred near major market turning points).
We Are Still In a Bull Market.
If you are looking for another bullish sign, it isn't hard to find one in this market environment.
 Here is one: Sectors are holding up, even when an individual stock tanks. A recent example is what took place after Research In Motion (RIMM) released a bad earnings report. The stock was absolutely annihilated. Yet, even thought the stock got slammed, the rest of the market did not. That's a sign we're in a bullish phase. In bear markets, the whole sector will be taken down if a stock reports badly.
These are the little subtle hints about where we are at the moment. It doesn't mean it'll be this way a week or two from now, but it is that way for the moment.


