There has been a lot of talk about housing lately.
Some are predicting a second dip.
What does the data show?
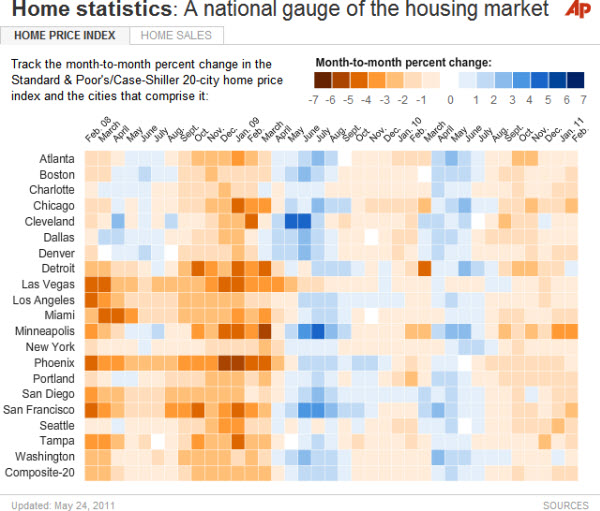
Here is a very nice visualiztion that shows the monthly percent change of home prices in various markets over time.
Notice, that things got better after March of 2009 … but have been slipping since last summer.


