Wouldn't it be great if a simple number told you whether it was safe to bet on the market going higher?
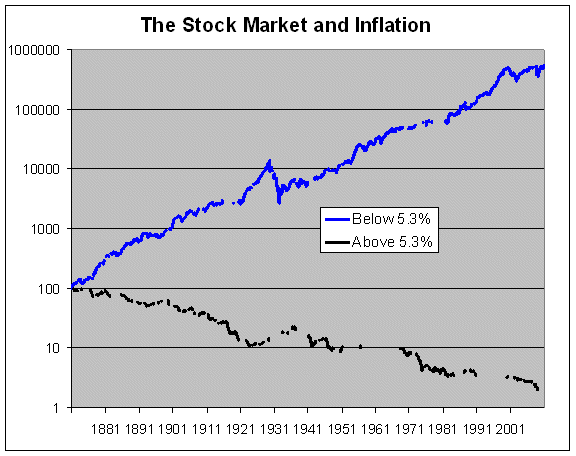
Crossing Wall Street posted a chart that suggests the stock market does very well when the monthly inflation rate is under an annualized rate of 5.3%. Conversely, the market has done poorly in months when inflation is above that 5.3% annualized level. The chart shows the the monthly return above and below that level of inflation.

The data goes back to 1871; and it is surprising how well this relationship has held up over 140 years. During this period, monthly inflation has been above the 5.3% annualized level about one-third of the time.
Historically, when inflation was below 5.3%, the stock market has had an annualized after-inflation gain of 9.59%. And when inflation was above 5.3%, then the stock market has had an annualized loss of 8.15%.
Did Inflation Cause Returns to Change?
Computers are great at finding the optimal point for a system to trade based on historical data. Technical traders call this "curve-fitting", and have learned to be wary of coincident variables being confused as causal variables. That is a fancy way of saying that the relationship between inflation levels and stock market returns might be a great way to "describe" what happened; however, it doesn't prove that the inflation level "caused" the returns to go up or down. It also doesn't prove that inflation didn't cause the returns.
Nonetheless, 140 years is a long time sample … and inflation rates affect people reasonably uniformly … and the stock market can be looked at as collective measure of the fear and greed of the population. So, using the inflation rate as a trading filter seems to be a reasonable idea worthy of further testing. What do you think?
With many market watchers expecting the inflation rate to rise, this is something to consider.


trading style is devoted exclusively to scalping, or carving out small chunks of price movement in a broader trend. As a scalper, I try to limit the parameters and variables that traders with longer investment horizons must take into consideration. In short, I am interested in momentum and, more specifically, price action. Renko charts are unique in that they deal only with price; there is no consideration is given to volume or time.