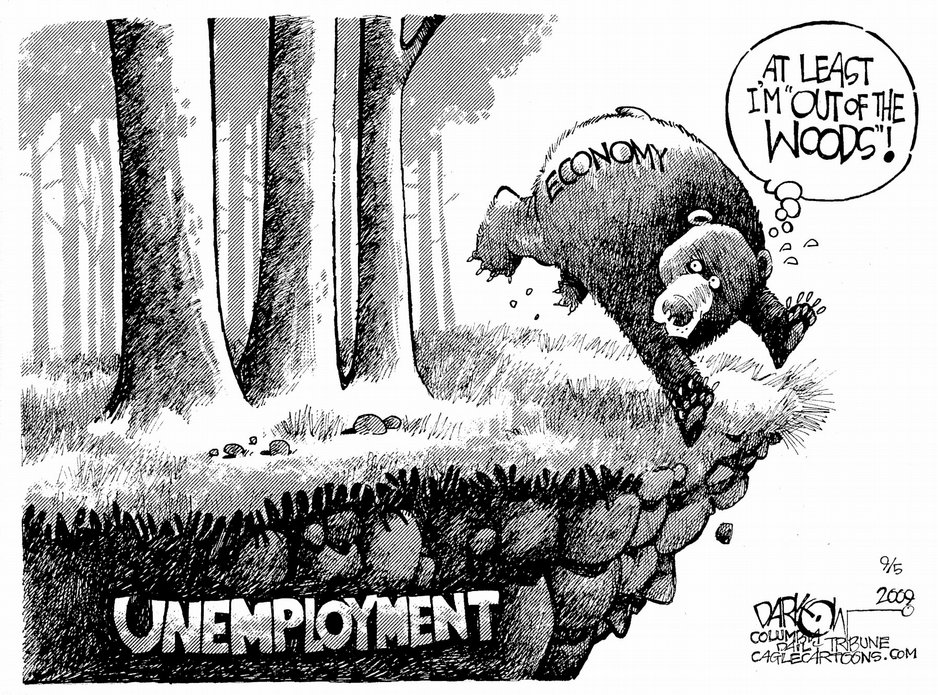
Recently, corporate earnings and the stock market have thrived, even as the economy has lagged.
Meanwhile, we continue to get negative Jobs reports.
Employment Numbers.
Troubling unemployment numbers weaken the hopes of economic recovery. It is worth pointing out that more companies seem to be hiring now. Nonetheless, the numbers haven't been improving as fast as many would like (especially those still out of work).
Have recent quarterly results (showing corporate profits) been based on cost-cutting, rather than real revenue growth? If so, the results may not prove sustainable.
As we move towards Q2 results, revenue will likely be a more telling indicator. This is something that bears watching.
The Implications of Cost-Cutting.
Jon Talton put out an interesting post; here is a small excerpt.
If you missed the news, the new San Francisco-Oakland Bay Bridge is being built in China as modules to be assembled in California. Fourteen million Americans are officially unemployed and the U-6 (real) rate of unemployment in the Golden State is 22 percent.
The project is, according to the New York Times, "part of China’s continual move up the global economic value chain — from cheap toys to Apple iPads to commercial jetliners — as it aims to become the world’s civil engineer."
Whatever it is for China, it represents the "Catch-22" many companies (and governments) find themselves facing … how to save money, short-term, even if it has negative long-term consequences.
Do You Expect to Hear Weak 2nd Quarter Results?
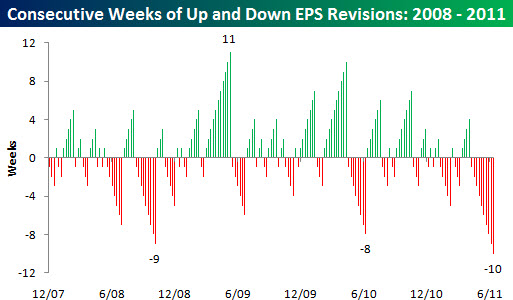
Bespoke posted some research showing how pessimistic analysts are becoming about earnings.
They track the the number of companies in the S&P 1500 seeing positive and negative EPS revisions in a given week. In the chart below they calculated the number of consecutive weeks that the net earnings revisions ratio increased or decreased.
Green bars indicate consecutive weeks where the revisions ratio increased, while Red bars indicate streaks where the earnings revisions ratio decreased.
As shown in the chart, the net earnings revisions ratio has now decreased for 10 consecutive weeks.
This is the longest such streak of declining analyst sentiment, going back to the end of 2007. It surpasses even the nine week streak seen in the aftermath of the Lehman bankruptcy.
Looking at this data, it is hard to argue that analysts are positive heading into this earnings season.
Let's Look Under the Surface at Market Breadth.
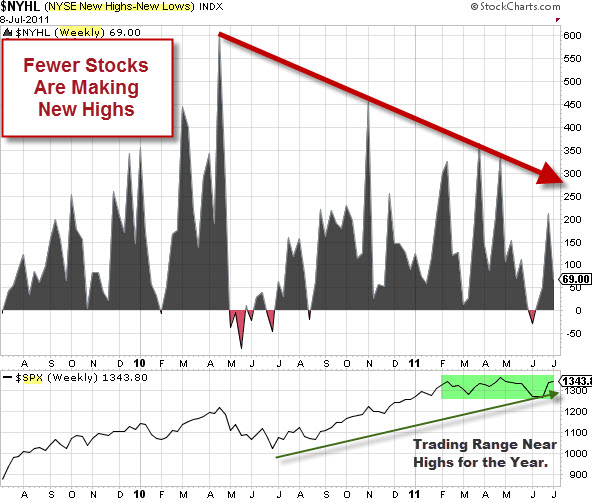
This chart looks at NSYSE stocks making new 52-week highs, and subtracts the number of NYSE stocks making new 52-week lows. That means we get more Net New Highs when the markets are doing better.
As it stands, even though the S&P 500 Index is making highs for the year, there are considerably less Net New Highs than we earlier in the year. While this is a little picky, it does constitute a negative divergence. Consequently, I'm watching what happen in this measure as a potential early indicator of market change.


Hi,
there are a lot of things involved with reading a stock and reading the stock market… earnings, news, whether it’s good news or bad. Watching CNBC or Bloomberg is a good way to learn the “language” of the stock market… I am an options trader.. what helped me was to learn how read stock pricing was candlestick patterns. It’s long and tedious, but if you want to learn you should try learning candlesticks.