Bulls and Bears are watching this chart for signs that the other side is giving up.
Meanwhile, price has been moving within a fairly narrow decision zone.
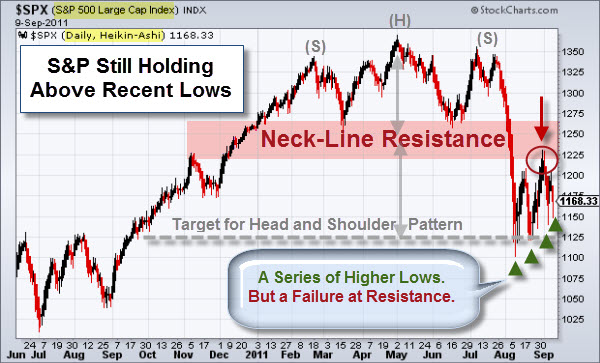
A look at a daily chart of the S&P 500 Index shows that it recently bounced off the target zone of the recent head-and-shoulders topping pattern (shown by the grey dotted line). Since then, it has made a series of higher lows (marked by green arrow); only to fail at the neckline resistance (marked by the red arrow).

While price has held above recent lows, we have still seen fairly strong selling.
The Dow Jones Industrial Average and the NASDAQ both show similar patterns.
Consequently, traders may expect to see bears push the short side while trading stays beneath resistance. A poke below the early August bottom wouldn't surprise me, and would likely take out a bunch of stops.

