We just saw a very nice week in the Markets.
Is it time for another Bull Market?
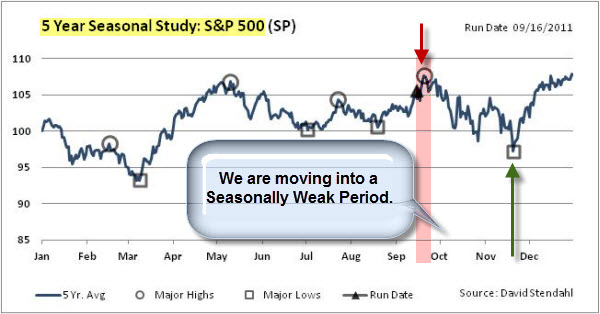
Seasonal charts of the S&P 500 Index show that a pattern of weakness typically starts around this time of the year.
Below is a chart showing the 5 Year Seasonal Study. It also highlights the strong year-end performance that the Market has enjoyed.
Click the chart to see other seasonal studies done by David Stendahl.


