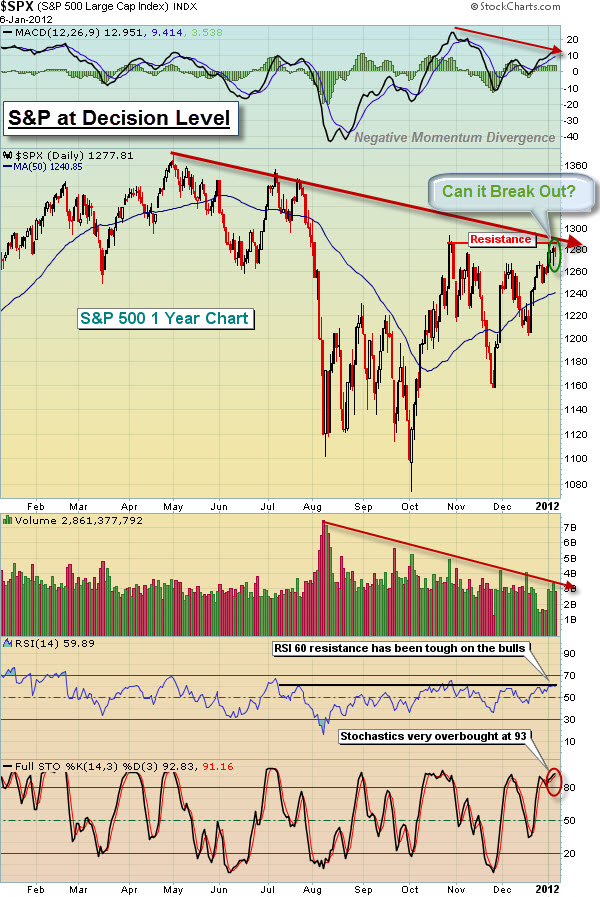
The S&P 500 Index is flirting with a move above a key resistance zone.
This chart shows the Index for the past year. Note that Price is sitting just under major overhead resistance (both horizontal and from the downward sloping trend line).
A move higher here, would flash a buy signal that could trigger a lot of buying.
In addition, It seems that each time that stochastics and RSI hit 90 and 60, respectively, the bulls have recently run into trouble extending the rally. Currently, that's where both of those momentum oscillators sit. Add to that the negative divergence in MACD and weak buying volume … In other words, many secondary indicators hint at the burden faced in moving higher.
Nonetheless, a sustained move above these levels would give Bulls fresh fuel. With the strong start to an election year, many traders are planning what to do during the next move higher.


