Sometimes reading a chart is simple.
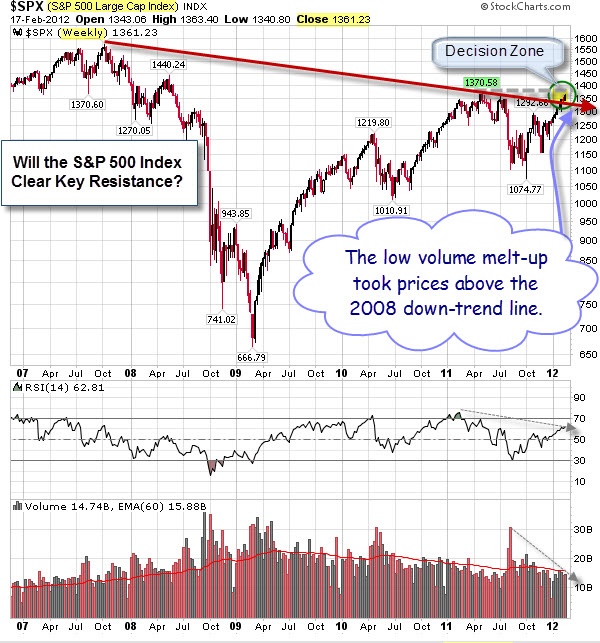
Here is the obvious question: Will the the S&P 500 Index be able to stay above its 2008 to 2012 resistance line (marked by red arrow on this weekly chart)?
The recent highs (at 1370) are directly overhead. A move above that would be decidedly bullish.
Nonetheless, the recent rally is extended and happened on low volume.
Bears will note that there are many negative divergences, too.
However, the key indicator is the price action … and it has been un-relentingly higher (despite many logical reasons for it not to have happened).


