The S&P 500 Index had its biggest weekly drop of the year last week, with a less-than-whopping fall of 0.50%.
Yep, half a percent. Moreover, it was only the second week of the year out of twelve in which the index posted a decline. Results like that make traders fat, dumb and happy.
With a year to date gain of more than 11%, the S&P 500 is on pace for its second consecutive quarter of 10%+ gains. According to Bespoke, if this holds, it will be just the 12th time in the index's history that it has posted double digit percentage gains in back to back quarters.
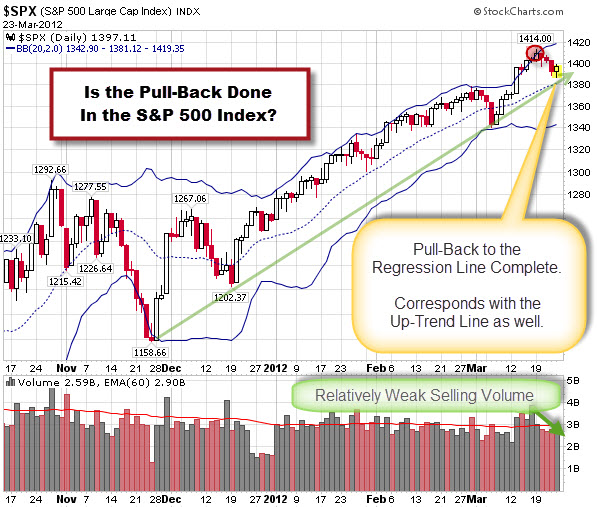
Here is a chart showing the daily performance of the Index.

Note the area circled in red. That marks where price came back inside the upper Bollinger Band. Technical analysts might expect that the first likely target would be the mid-line (marked by the dotted blue line). In this case, it also corresponds with likely support at the short-term up-trend line (marked by the green arrow). Add the weak volume of the recent decline … and you might have the recipe for a new rally?

