What an Interesting week we just had. Facebook is buying Instagram for $1 billion; AOL struck a $1 billion deal to provide hundreds of patents to Microsoft; Sony is cutting 10,000 jobs after its worst fiscal year ever; and “The Lion King” has passed “The Phantom of the Opera” as the highest-grossing Broadway musical ever.
On the other hand, the Markets suffered the toughest week they've had this year.
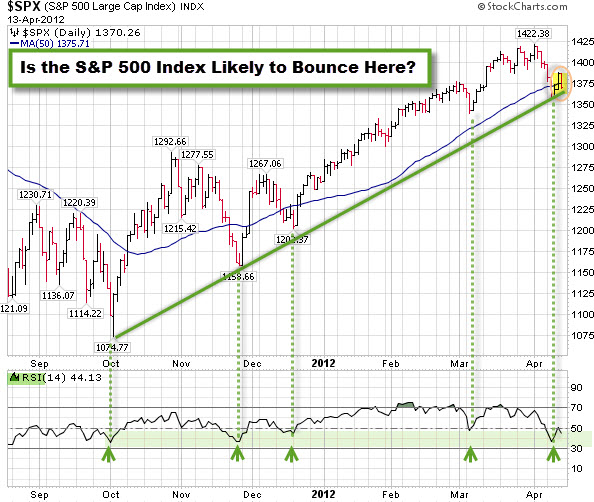
Here is a chart of the S&P 500 Index. With price flirting with the 50-day moving average and testing the support of the Index's recent up-trend … perhaps this is a likely bounce point.

Also, notice the relative strength indicator at the bottom of the chart. As noted by the green arrows, an RSI reversal higher from the highlit zone has been a good indicator that the broader market will likely move higher as well.
On the other hand, a failure to move higher here could feed the "Sell in May and Go Away" crowd. What do you think?

