 In the first part of this series, we discussed that a Market is a collection of separate traders, and much of the analysis done to get a trading edge is really just a way to identify "who is in control" and what they are doing … rather why they are trading.
Here we will examine why some traders rely on certain patterns to identify favorable trading conditions.
Some Patterns Are Logical.
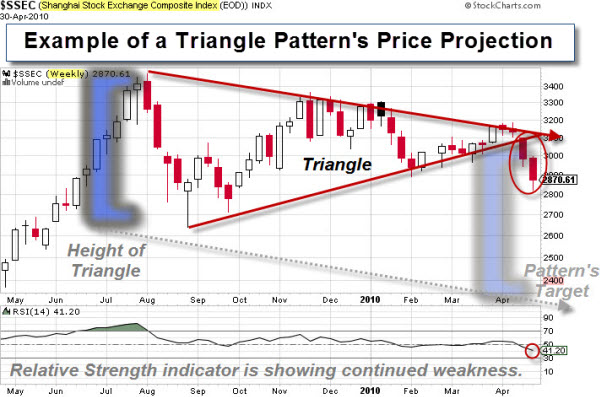
Let's look at a common trading pattern, called a "Triangle". You can think of the Triangle as a well-contested battle between the bulls and the bears. It is almost like an arm-wrestling match. Inside the pattern, neither side gives-up much ground. However, when one side loses conviction, the market surges in the direction the winners push it.
Here is a picture of a Triangle and the pattern's likely price projection.
Triangles are an example of a logical pattern. It is easy to see, and easy to understand. In addition, for a trader, it is easy to use a setup, like this, to define the likely risk and reward of a trade they are considering.
Why Do Patterns Form in Markets Repeatedly? The Answer is Human Nature.
Markets are not always logical. Some would argue that Markets are rarely logical.
On some level, markets represent the collective thoughts and emotions of its participants. So, even though conditions change, the collective response to fear and greed remains reasonably similar.
As a result, many patterns show up in market price data.
In General, Here's What Is Happening.
A move up of a certain degree will be met with some people who are afraid the move won't go higher … so they decide to sell. Meanwhile, others will believe the move will trigger a whole different group of people to recognize an opportunity … so they decide to buy.
The same thing happens with a big move down. At first, it triggers fear and selling. But at some point, to a certain group of traders, the move down will look like a discounted buying opportunity.
At its core, price is the primary indicator of investors' willingness to buy or sell. Things like velocity or slope are secondary, and show the intensity of their motivation.
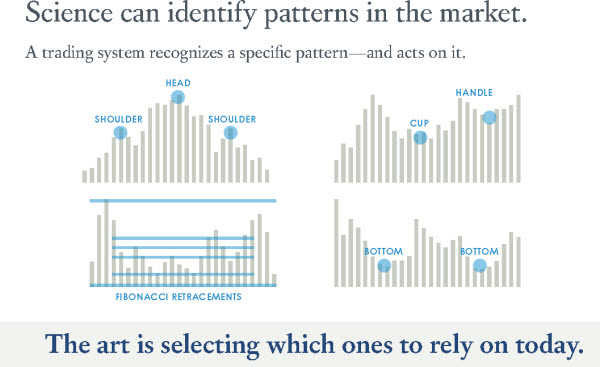
So, many of the patterns that you read in books or magazines (with names like "head and shoulders", or "cup and handle", or "double bottoms") are all really just ways of explaining the natural response to certain conditions.
There is science involved in recognizing a specific pattern; and there is art involved in selecting which pattern to rely on today.
But You Don't Have to Predict Anyone's Action – All It Takes Is An Intelligent Response.
It's the law of large numbers. An insurance company doesn't have to accurately predict when any individual will die; their actuaries just have to figure out a reasonable estimate of how many people will die during a certain time period. Likewise, in the market, patterns don't predict what an individual will do, only what the majority is likely to do.
So now that you understand patterns, the rest is easy … right?
Fractals and Holograms.
 Of course it's not as easy as it sounds, because these patterns are being played out across every market, and happen on different time frames as well. That means some people are responding to the market using a much longer time horizon than someone else. A pattern for them may be noise at a different level of focus.
The patterns occur similarly whether you're looking at be minute by minute chart of the S&P, or a weekly chart of gold.
Since there are many patterns happening on many markets at any given time, it's impossible for a human to identify, validate, and trade all of them in real-time.
That's where technology comes in. And that is what we'll look at in the next article in this series.
Hope it helped. Let me know if you have questions or comments.


Pattern day trader is a term defined by the U.S. Securities and Exchange Commission to describe a stock market trader who executes 4 (or more) day trades in 5 business days in a margin account, provided the number of day trades are more than six percent of the customer’s total trading activity for that same five-day period.