There
we were at the Cowboys game. It was a beautiful day. I was feeling
terrific because I was with my two sons. The crowd was cheering … and I
had a great thought: 'Let's get a picture of this'.
Perfect … a random series of events had led to a satisfying crescendo … and I captured the moment.
It wasn't so random. Despite a difference of four years and two stadiums – the result was similar (if not predictable).
History doesn't necessarily repeat itself. But it often rhymes.
It Is True In Trading As Well.
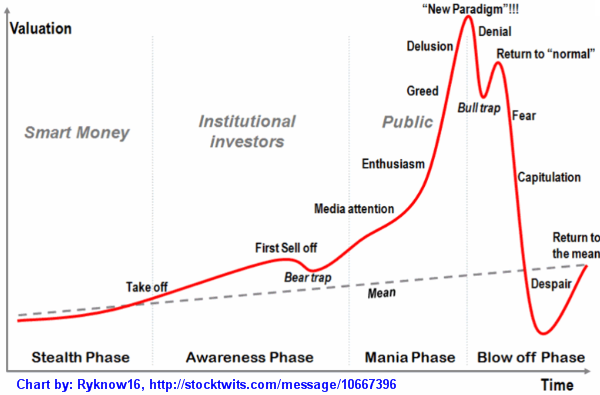
The Hype Curve is an interesting map of human emotion. Below is an idealized version.
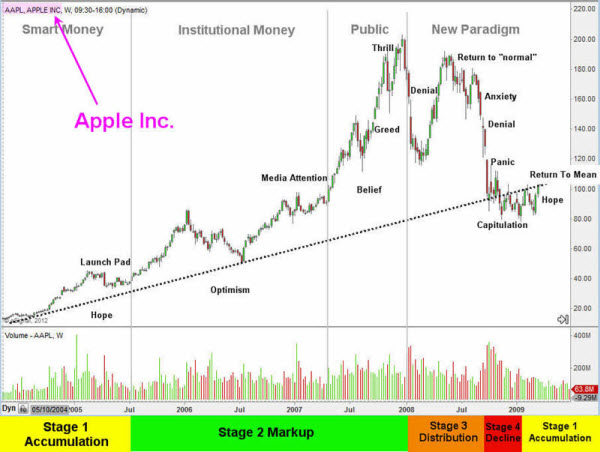
Here is a chart of Apple going back to 2004. Note the similarities.
For a deeper analysis, see this post by Market Oracle. Here is an excerpt explaining the framework.
Classic economic theory dissects the economic cycle into four distinct stages: expansion, trough, decline and recovery. A stock is no different, and proceeds through the following cycle:
- Stage 1 – After a period of decline a stock consolidates at a contracted price range as buyers step into the market and fight for control over the exhausted sellers. Price action is neutral as sellers exit their positions and buyers begin to accumulate the stock.
- Stage 2 – Upon gaining control of price movement, buyers overwhelm sellers and a stock enters a period of higher highs and higher lows. A bull market begins and the path of least resistance is higher. Traders should aggressively trade the long side, taking advantage of any pullback or dips in the stock's price.
- Stage 3 – After a prolonged increase in share price the buyers now become exhausted and the sellers again move in. This period of consolidation and distribution produces neutral price action and precedes a decline in the stock's price.
- Stage 4 – When the lows of Stage 3 are breached a stock enters a decline as sellers overwhelm buyers. A pattern of lower highs and lower lows emerges as a stock enters into a bear market. A well-positioned trader would be aggressively trading the short side and taking advantage of the often quick declines in the stock's price. More times than not all of stage 2 gains are given back in a short period of time.
While these stages are historically defined over long time periods they actually exists in all time frames, allowing traders to take advantage of a cycle regardless of their trading time frame. Fortunately this phenomenon, known as a "fractal", exists within all security markets. A fractal is simply a rough geometric shape that can be subdivided into smaller parts that have the same properties; a smaller version of the whole.
This is important to understand because through technical analysis as we are often analyzing multiple time frames. In the short term, the four stage model may repeat itself many times. The combination of these short term cycles form a medium term cycle, and the combination of multiple medium term cycles form a long term cycle.


