Trading doesn't have to complex.
Sometimes simple indicators are better. Trend lines are easy to follow and often meaningful.
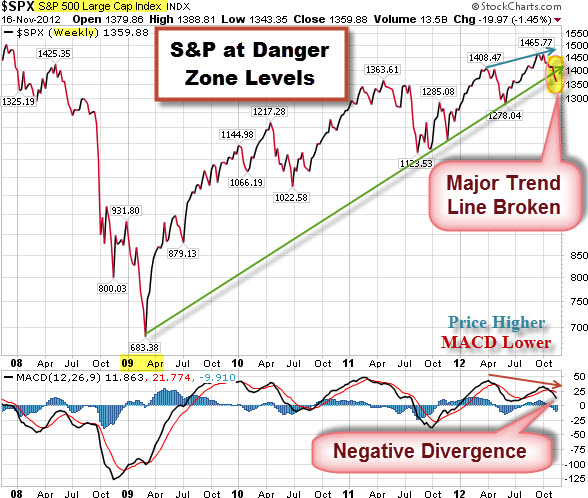
Below is a weekly chart of the S&P 500 Index showing the recent break of an up-trend in place since 2009. If price stays beneath this level, it will likely be tough for Bulls.
In addition to the trend line break, there is a negative divergence (where recent price highs happened with lower momentum). Technicians often take this to be sign of weakness.
Let's see what happens.


