
The Standard & Poor's 500 Index closed above 1,500 for the first time in more than five years on Friday.
The benchmark Index extended its rally to eight days.
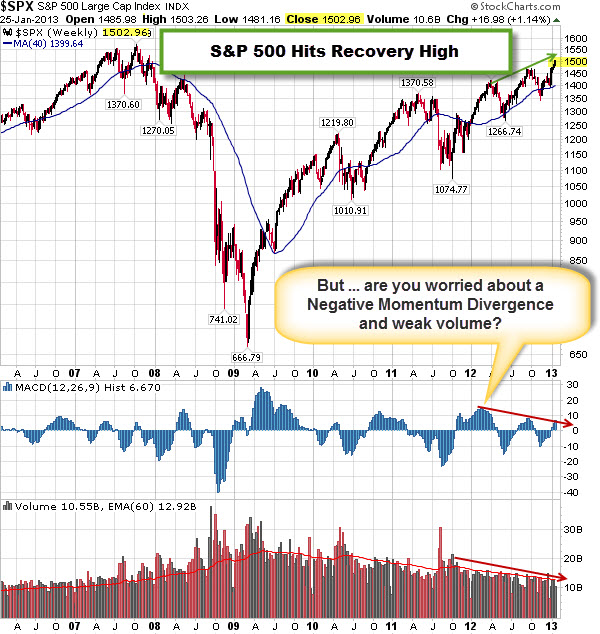
This winning streak is the longest in eight years and left the S&P 500 just 4% beneath its all-time closing high of 1,565.15 (set on October 9, 2007).

Meanwhile, some technicians will note the less than enthusiastic volume and the negative divergence (where recent price highs happened with lower momentum). These are often taken as early topping indicators (or signs of weakness).
Apple's stock has now dropped 37% since its September high of $702.10.
As a result, Exxon reclaimed its status as the world's most valuable company.
Do you attribute this to Apple's weakness … or an early warning that 'smart-money' is taking risk off the table?
Remember: Price is the Primary Indicator.
What do you think is the most bullish indicator of our markets?
It's not a trick question; the answer is "price". Despite the uncertainty about the economy, the markets have held-up nicely throughout this rally. And that, in-and-of-itself, is bullish.
It doesn't matter what technical analysis indicator you use (increasing negative divergences and selling on down days … or less positive momentum and market breadth), the markets have given us a clear message recently. Price is the primary indicator, and it has stayed above support.
Traders learn strong uptrends tend to trump bearish divergences. But it bears watching.
