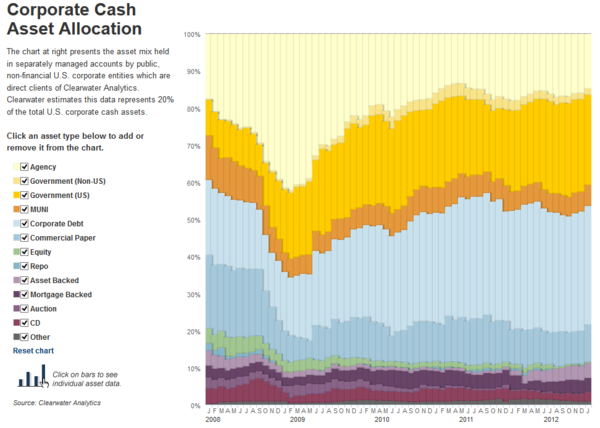
Here is a chart showing the asset mix held in separately managed accounts by public, non-financial U.S. corporate entities. It covers 2008 through the present.
via WSJ
Are you surprised by the allocations?
The green area represents equity … What does that say about Market confidence?


