Tracking the Hindenburg Omen: How Much Danger Is There?
 Warnings were heard from
many corners of the financial blogosphere that the Hindenburg Omen triggered.
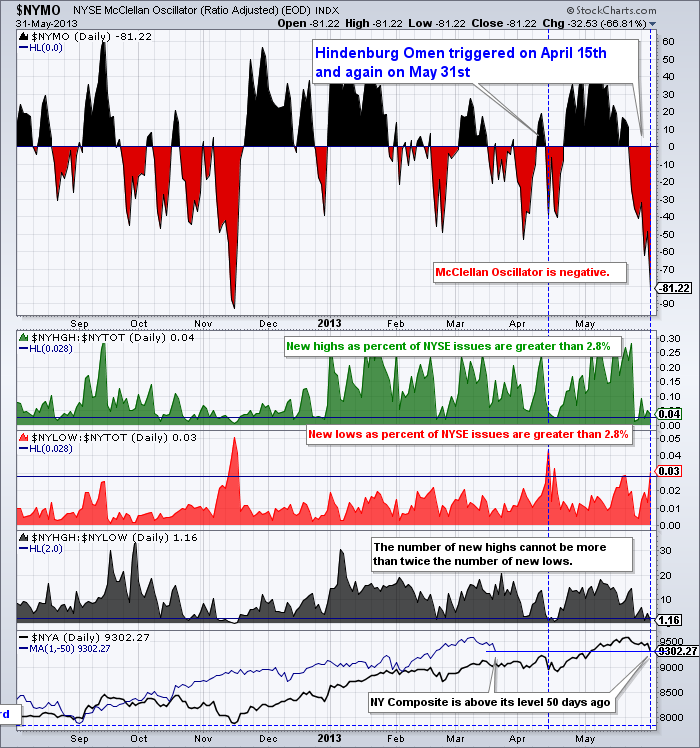
What is it? It is a fairly obscure technical analysis pattern, which supposedly gives an early warning of unstable market conditions (and even potentially stock market crashes).
While the calculation is based on five factors, the primary conditions indicate that there is a big disagreement about market conditions.
For example, two of the conditions are that a substantial number of
stocks have to be at yearly highs, while a substantial number of stocks
have to be at new annual lows. Ultimately, it is hard for those two
conditions to be met in a short period of time, unless there's
uncertainty in the market. Moreover, after a rally, uncertainty is
often a precursor to a decline.
In addition, technically (in order for the pattern to be complete), a
second sighting of the five elements must occur within 36 days.
Logically, lingering uncertainty is a momentum killer. Well, in this case we have it; the pattern flashed in mid-April and it happend again on the last day of May.
While this pattern has correctly predicted every big stock market
swoon of the past two decades, including the October 2008 decline (that
set the global economic recession into motion), not every Hindenburg
Omen has been followed by a crash. Resorting to a geometry analogy: All
rectangles are squares, but not all squares are rectangles.
Personally, I don't make trade decisions based solely on indicators
like this. Nonetheless, it has a pretty good track record, seems to be
based on reasonable theories, and might be useful as just another data point urging caution.


