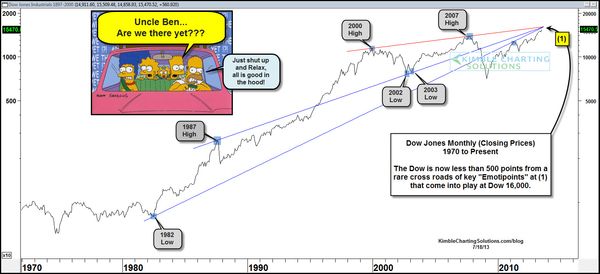
What do you get if connect these key "Emotipoints" (Emotional highs and lows)… The 1982 low, 1987 High, 2000 high, 2002 low, 2003 low and 2007 high together?
According to Kimble Charting, you get a rare combo of resistance coming into play at Dow 16,000.
The Dow industrials has been hitting record highs and is now less than 500 points (less than 3%) from this potential key technical price point.
From a technical perspective, the trend is your friend … and if the Dow does break above this resistance level, it will be viewed as a big positive by the Bulls.


