With the government shut down and the debt ceiling looming, one could argue that the U.S. economy may be on the edge of a crisis.
But the stock market is not reflecting this.
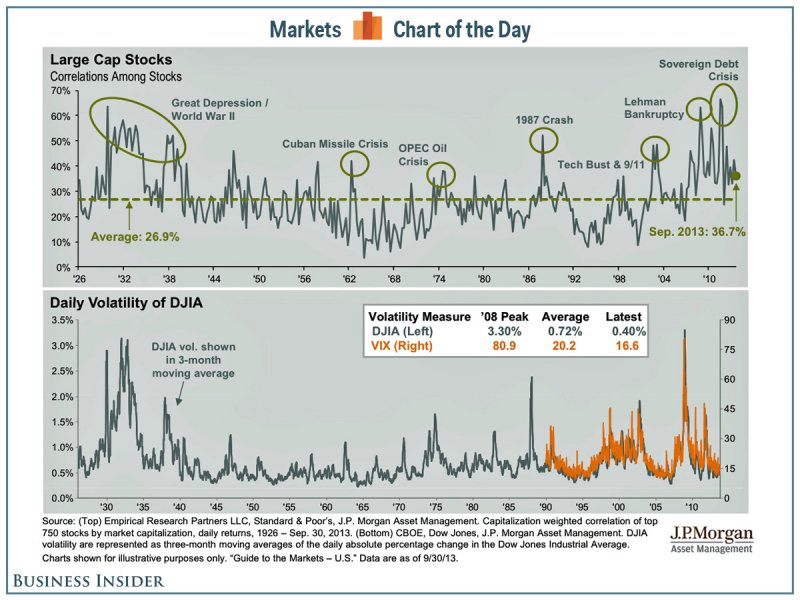
During periods of crisis and high stock market volatility, correlations among stocks increase. In other words, stocks move up and down together.
JP Morgan just published a quarterly market chartbook , which includes a useful chart tracking stock market volatility and correlations among stocks since the Great Depression.
Why? Perhaps Because Markets Tend to Go Up After Government Shutdowns.
We are in the 18th government shutdown in US history.
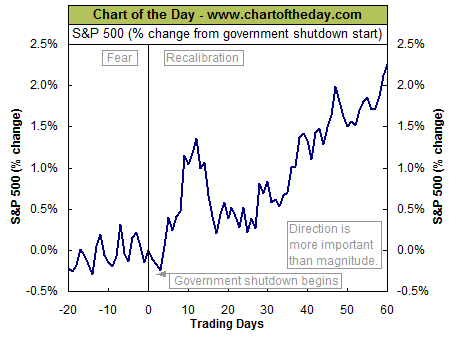
For some perspective, this chart plots the average S&P 500 performance for the 20 trading days (approximately one calendar month) before and 60 trading days (approximately 3 calendar months) after a government shutdown began.
The chart illustrates a bullish pattern. While the stock market has tended to struggle prior to and during the initial three days following a government shutdown … Following this, the stock market has (on average) trended higher over the ensuing three months.
One explanation for this particular average pattern is that the market abhors uncertainty. So as the shutdown approaches, investors fear for the worst. However, after the shutdown begins and investors notice that the economy continues to function (coupled with the fact that the shutdown may be short-lived) ultimately encourages a stock market rally as investors worst fears are not realized.
It should be noted that this chart is an 'average performance chart' and that following the last 17 shutdowns, the stock market traded up 60 trading days after a shutdown on 10 out of 17 occasions (i.e. 58.8%) with the average shutdown lasting 6.4 calendar days.


