"Insider Selling Mounts as Markets Hit All-Time Highs" screamed the headline.
A glance at the charts showed that the S&P 500 Index tested below its 50-Day Moving Average for the first time in a long time.
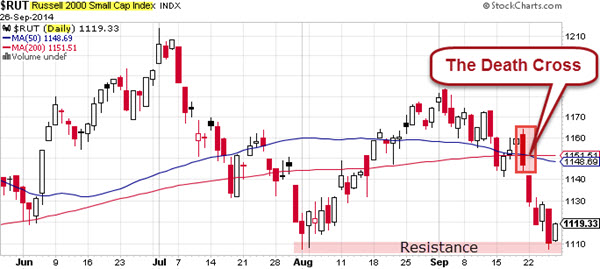
Meanwhile, the Russell 2000 index experienced what technical analysts call a “Death Cross” … where the near-term 50-day moving average dips below its long-term 200-day moving average.
What does it mean?
The "worry" is that this move is the beginning of a new bearish trend … and the long-term moving average is seen as the new resistance level.
So far this year, small-cap stocks have underperformed their larger counterparts. Year-to-date, the Russell 2000 is down almost 3% while the S&P 500 has gained over 7%.
Moreover, the small-cap index has been weakening and is off almost 7% from its all-time high set at the start of July, while the large companies in the S&P 500 and the Dow Jones Industrial Average have been hitting new highs.
The main issue is that small caps are under-performing and traders wonder what that says about the strength and breadth of the recent rally.
Nevertheless, the last time the Russell 2000 formed a death cross in July 2012, no significant sell-off followed as the index recovered and continued an uptrend. My guess is that this pattern would get far less media attention if it was named "Phlarg" or a "50/200 Crossover".
These are the types of "early warning signs" you should watch. However, they are just early warning signs … until they prove themselves to be more.

