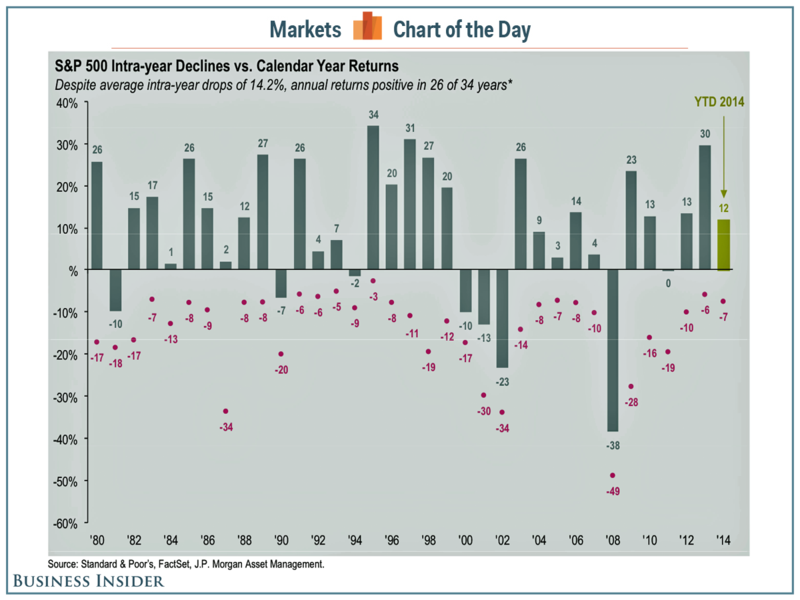
No matter how you look at it, big stock market sell-offs happen regularly.
For example, we've seen two violent sell-offs in the second half of 2014. The first came when the S&P 500 quickly tumbled 9.8% from its then all-time high of 2,019 on Sept. 19 to as low as 1,820 on Oct. 15. The second came when the S&P plunged 5.1% from 2,079 ion Dec. 5 to 1,972 on Dec. 16.
Buy and Hold investors must stomach significant drawdowns to get their returns — even in 'good' years.
This chart shows S&P 500 intra-year declines compared with calendar year returns. The bars represent year-end returns since 1980, while the purple dots mark each year's market low.
Business Insider via JP Morgan Asset Management.
Basically, you have to understand that 10-15% pull-backs are normal (perhaps even healthy) for the market.
For reference, here are market correction averages and their historic frequency. Since 1900, we've seen:
- 5% market corrections: 3x per year.
- 10% market corrections: Once per year.
- 20% market corrections: Once every 3.5 years.
Importantly, these big sell-offs often occur during years when the markets head higher.
Despite average intra-year drops of 14.2%, annual returns have been positive in 26 of 34 years.
Bottom line: Sell-Offs happen. And sometimes they're big … But they're normal. So, stay calm and carry on.
Best wishes for a Happy New Year!

