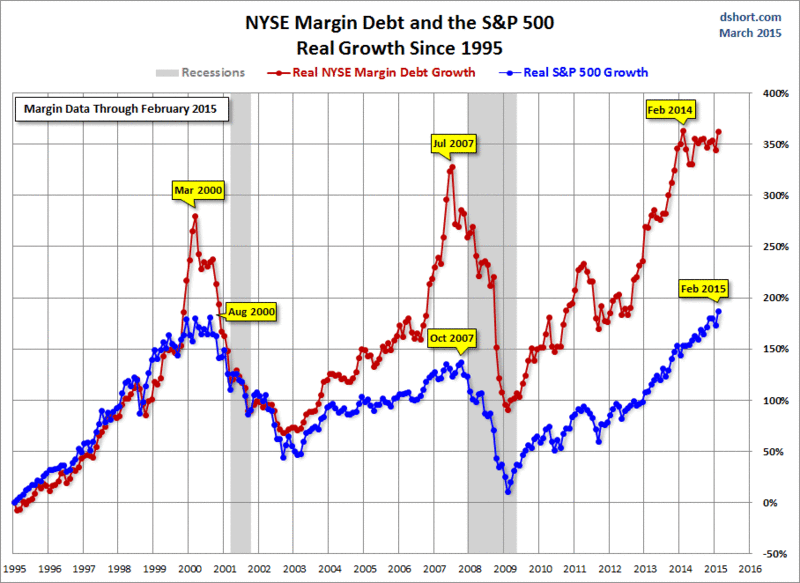
Margin debt hit a record of almost $465 billion on the New York Stock Exchange in February, as investors borrowed more money than ever to buy into the post-financial-crisis bull market.
On one hand, that’s a good thing, for now, because it shows confidence. But, on the other hand, some traders believe that rapidly rising margin debt can be an early indicator of a market top.
This chart compares the percentage growth of Margin Debt to the S&P 500 Index going back to 1995, based on real (inflation-adjusted) data.
via D. Short in Advisor's Perspective.
Is it a coincidence that the "tops" align?
Margin debt grew at a rate comparable to the market from 1995 to late summer of 2000 before soaring into the stratosphere. The two synchronized in their rate of contraction in early 2001. But with recovery after the Tech Crash, margin debt gradually returned to a growth rate closer to its former self in the second half of the 1990s rather than the more restrained real growth of the S&P 500. But by September of 2006, margin again went ballistic. It finally peaked in the summer of 2007, about three months before the market.
So, where are we now?
Note that NYSE only releases margin statistics after a six-week delay; so it is tough to trade off them directly.

