On Friday, Aug. 21, the Dow Jones Industrial Index fell below 17,000. That means the Dow has now shed well more than 1,700 points in just 90 days. The day before was the S&P's worst day in 18 months.
Things look like they are moving fast. But, for the past several months, the US markets have s-l-o-w-l-y rolled over — with the Dow leading the way.
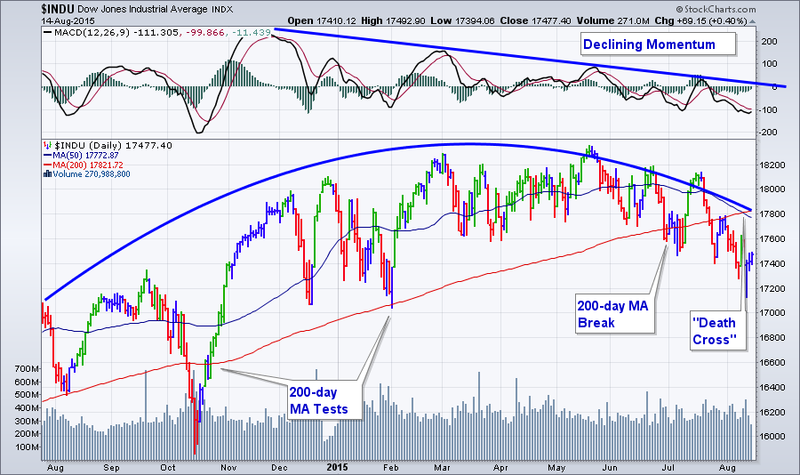
Lots of people are talking about the "Death Cross" that occurred on the Dow's daily chart early last week (when the 50-day simple moving average moved below the 200-day average). What led up to it? Here is a chart from a week ago.
via StockCharts.com
When a market rolls over slowly like this, the first thing to go is the uptrend's momentum.
To see this market's declining momentum, note that MACD (shown in the upper indicator window) has been moving lower for months.
The next thing that happens is increased interaction with the 50-period moving average. Followed by tests of the 200-period moving average. Then comes a definitive break below the 200-period average and then finally the "Death Cross" occurs - which is where we are at with the Dow.
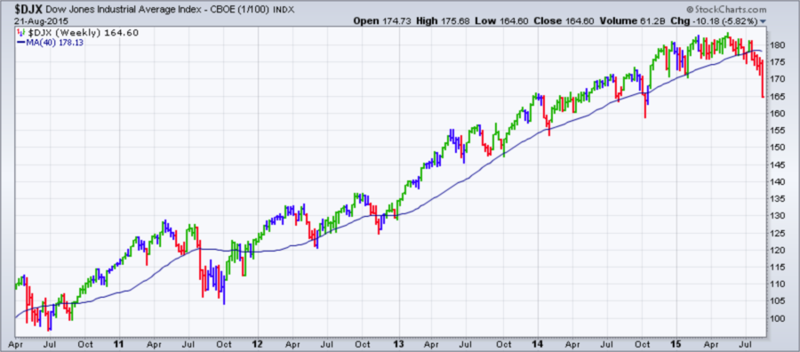
A longer-term weekly chart shows the slow "text-book" roll-over from a different perspective.
via StockCharts.com
The 40-period weekly moving average corresponds to a 200-period daily moving average.
This drop takes us back to levels seen at the start of 2014.
Even though the current trend is clearly down, we are approaching a likely decision zone. If we don't get a bounce here, the election season will be a different game.
What do you think happens next?


