Impressive rally … Now what?
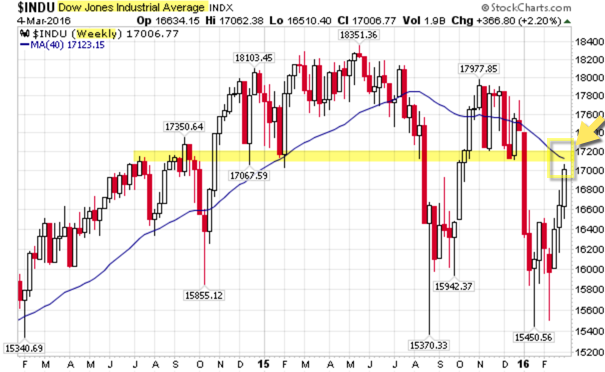
Here is a weekly chart of the DJIA. Price has rallied to the overhead support/resistance level and its 40-week moving average (which is also its 200-day moving average).
via StockCharts.
Meanwhile, according to StockCharts, the percent of NYSE stocks trading above their 50- and 200-day moving averages is soaring. Currently, 73% are above their 50-day lines (which is close to the level hit during the November peak) … and 34% are above their 50-day lines. That reflects the short-term improvement gained during the last month in major stock indexes.
What happens here, at the resistance barrier, will help determine if the short-term rally has more staying power.

