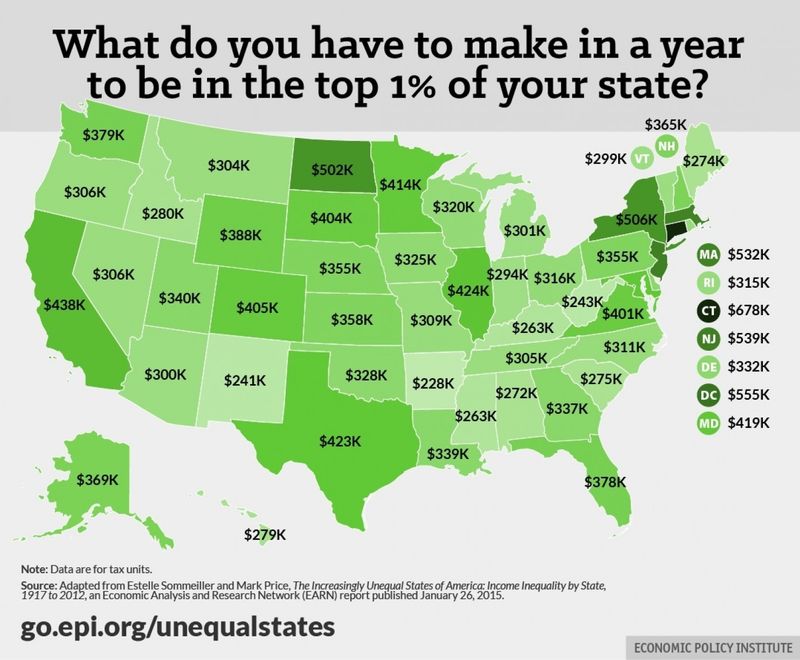
Where you sit in the country's economic hierarchy?
Thanks to research from the Economic Policy Institute (EPI), a nonpartisan think tank, we now have an in-depth analysis of income distribution trends.
EPI's website also has an interactive fact sheet that displays in-depth information state by state. On those fact sheets visitors can find statistics including what percentage of income growth the top 1% has snagged since 1979 and 2007 and how much income has grown for the top 1% and the bottom 99% between 2009 and 2012.
In 17 states, all income growth between 2009 and 2012 went to the top 1%.
New York and Connecticut are the two most unequal states, with the average 1%-er earning over 48 times what the rest of those states' populations earn. West Virginia is the least unequal state with a still-huge income disparity of 16 to 1 on average.

