There has been a pull-back off recent highs. Is it a buying opportunity or a danger sign?
Research published by Yale Hirsch in the Stock Trader’s Almanac argues that the market year is broken into two six-month seasonality periods. The period from May 1 through October 31 is seasonally unfavorable, and the market most often finishes lower than it was at the beginning of the period. Conversely, the period from November 1 through April 30 is seasonally favorable, and the market most often finishes the period higher.
While the statistical average results for these two periods are quite compelling, trying to ride the market in real-time in hopes of capturing these results is not always as easy as it sounds.
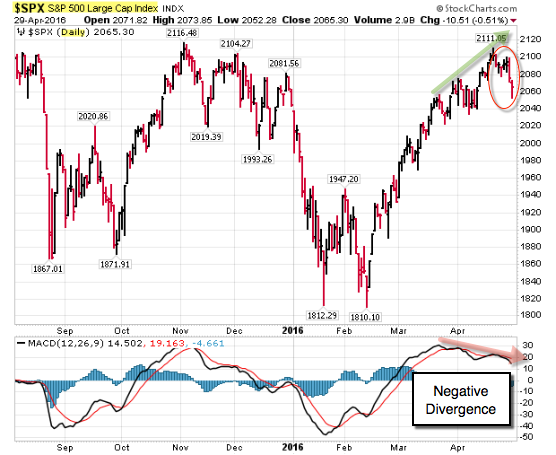
Here is a chart of the S&P 500 Index showing the recent thrust higher and recent correction. In addition, notice the negative divergence (where recent price highs happened with lower momentum). This is often taken as an early topping indicator (or sign of underlying weakness).
via Stockcharts.com.
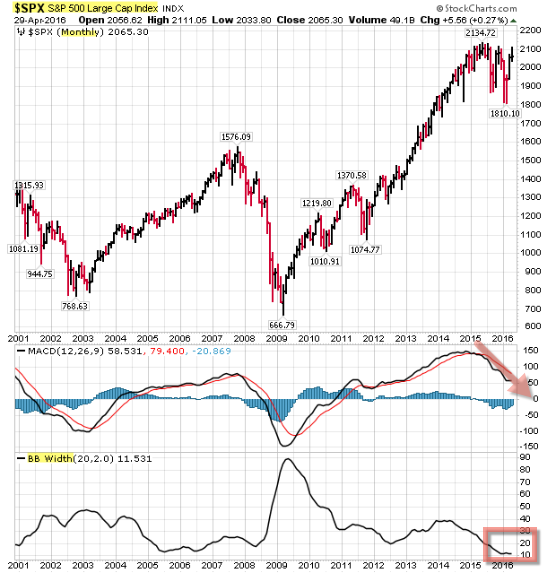
Meanwhile, the monthly chart shows weakness too (with negative divergences and a classic volatility squeeze).
via Stockcharts.com.
Traders expect a big move after periods of compressed range (like the one we are in now). One of the indicators I keep an eye on is the band-width of Bollinger Bands (which is a measure of volatility). When it gets narrow for an extended period, that "squeeze" puts me on alert for expanding volatility.
What do you do? You watch price. Yes, we are near highs in an up-trend. On the other hand, there's everything else.
Put that with the "Sell in May and Go Away" theory … and what you have is a caution light.


