We’re now three trading days into the month of June, and the market is pretty much right where it ended May … Near the highs, but with faltering momentum.
Even though there haven't been big end-of-day gains or losses yet, the action has been noteworthy.
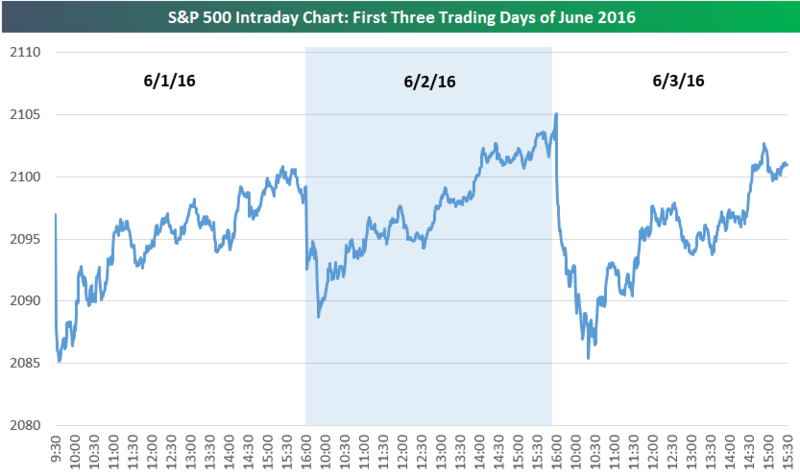
As you can see in the intraday chart of the S&P 500 below, there has been a big sell-off each morning, just after the open of trading. However, that has been followed by steady buying throughout the trading day – all the way into the close.
Early-morning selling followed by steady intraday buying, especially into the close, is seen as a bullish signal for the market.
Moreover, there was intraday buying, even on Friday, as the market digested a horrible jobs report at 8:30 AM ET. Nonetheless, buyers stepped in by 10:30.
S&P 500 Sector Breadth Levels
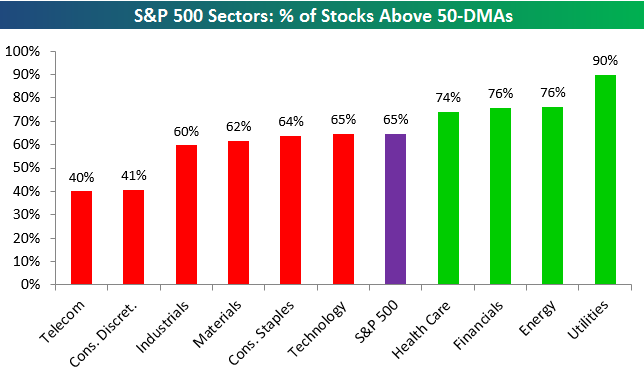
In addition, below is a look at S&P 500 sector breadth levels (as measured by the percentage of stocks trading above their 50-day moving averages).
According to Bespoke, 65% of stocks in the S&P 500 are trading above their 50-days (which is a solid reading).
Sectors where breadth is strongest include Utilities, Energy, Financials and Health Care.
While the Financial sector still has a stronger reading than the S&P 500 as a whole, its breadth was much stronger prior to Friday's jobs number. The weak employment number pushed rate-hike estimates further out, and Financials had been performing well due to increased hawkishness from the Fed prior to today.


