
Time flies when you are having fun. We're almost halfway through the year, and the markets have rallied now for three-plus months. That sounds positive … So why are so many people focused on the Federal Reserve's two-day meeting that ends Wednesday? My guess is that many investors will be watching for any changes in the long-term economic outlook.
So we are at a Tipping Point, once again. There is cash on the sidelines waiting for a sign that it's safe to get back in the game; and there are investors who are looking to protect their rally profits, or are afraid of the next leg down.
This daily chart of the Dow Jones Industrial Average Index highlights what bulls and bears see. We'll soon know which is more committed.

From my perspective, I understand why discretionary traders might want to try to buy this pull-back. There is a clear Risk-Reward; and it's easy to set your stop. However, experience warns me to be wary of set-ups like this where market breadth is weakening. My wife doesn't like charts that have too many marks on them … she says they are confusing. So I tried to find a different image that conveys what this chart may be whispering to the little bird.

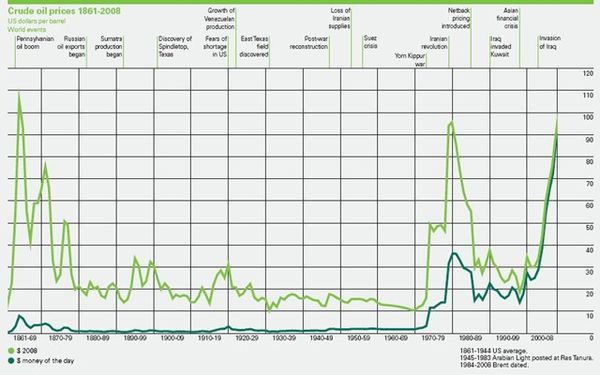
Finally, I was reading Paul Kedrosky's blog when I ran across this chart showing the price of crude oil from 1861 through 2208. It comes from BP. It provides an interesting perspective.
Business Posts Moving the Markets that I Found Interesting This Week:
- This Recession Tracks the Great Depression, Can We Avert the Worst? (FT)
- Charts of the Recession In Historical Context. (Investment Postcards)
- The Importance of "Being Right" vs Making Money. (Dash of Insight)
- Economic Recovery: Are Happy Days Here Again? (Wharton)
- The Myth of the Rational Market. (Slate)
- MF Global Preps Managed Futures Offerings. (FinAlternatives)
- Key Ideas from Forbes CEO Conference. (Forbes)
- More Posts Moving the Markets.
Lighter Ideas and Fun Links that I Found Interesting This Week
- Microsoft Readies Free PC Security Software. (Technology Review)
- Ten Commandments from Entrepreneurial 'Evangelist' Guy Kawasaki. (Wharton)
- Plan To Teach Military Robots the Rules of War and Let Them Loose. (NewScientist)
- Amazon Acquires Two iPhone App Software Makers. (WSJ)
- Google Searches for Ways to Keep Big Ideas at Home. (WSJ)
- New Research Shows That Fat Can Be Good For You. (Ode Magazine)
- MoneyB-ball 2.0 – Quantifying Basketball’s Intangibles. (NYTimes)
- More Posts with Lighter Ideas and Fun Links.