While the market did pull back, as expected, it was orderly and relatively mild.
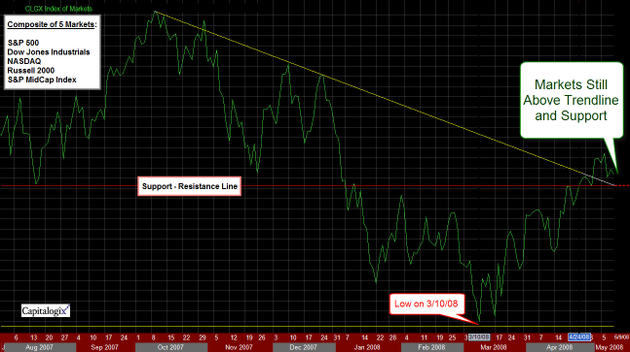
The chart below shows daily view of a composite of the 5 markets we currently trade.

The Markets are above the red support line and the yellow down-trend;
both of those are bullish indicators. Though not on the chart by itself, last week the S&P 500 index could not hold above the 1400 level that we’ve been following. That is
worth watching this week.
Also note that this chart shows that
the rally from March 10 through last week retraced just over 50% of the
loss from the October highs.
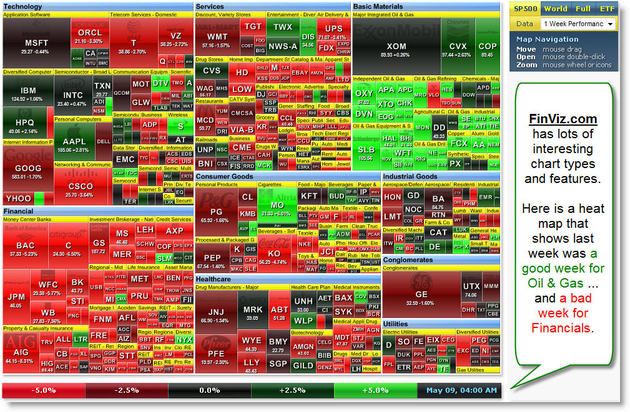
The graphic below is a market heat map from FinViz that shows that last week was good for the Oil & Gas sector (because it shows up as mostly green) and bad for the Financials (shown mostly in bright red).
 This free site has a simple yet powerful stock screener, maps that allow you to see sector and stock rotation, and insider trading info. It is worth checking-out.
