 Black Friday came in several ways this year. Yes, there was shopping. However, the markets had a dark few days, too, as the world markets quaked at the news of Dubai's sovereign debt default.
I've always believed that you can tell a lot about the current character of the market based on how it responds to news. Sometimes markets go up on good news, and go down on bad news. That seems normal. On the other hand, I take it as a bearish sign when markets sell-off after good news. Likewise, I take it is a bullish sign when markets go up, despite bad news.
So, it wasn't surprising that markets reacted negatively to the largest sovereign debt default since Argentina. It was, however, somewhat bullish that the US equity indices went down as little as they did. Yes, I know that our markets were closed on Thursday (when most of the damage was done globally) because of our Thanksgiving holiday. And I also realized that Friday was a half day and had relatively light volume. Nonetheless, it could have been worse; much worse.
Here is a link to a post I wrote that I think is worth reading at this point in the markets. I called it "What My Dogs Can Teach Us about Markets". It's really about how perceived danger puts us on alert; and why the second perceived danger often receives an even greater response. The point is that the world is now on alert, and I'm watching how calmly (or not) the market reacts to news.
Market Commentary.
The markets continue to hold up well on the surface. Underneath, I'm seeing signs of weakness (poor breadth, weak up-volume, fewer new highs, more negative divergences, etc.). Nevertheless, price has stayed above important levels.
With that said, here are some patterns worth watching. This chart uses 15-minute bars to get an intra-day look at the S&P Mid-Cap Index throughout November. The most notable thing I see is a character change in mid-month. The Bullish Break-Away Gaps seen at the beginning of the month are followed by two Bearish Island Reversal patterns (marked by the yellow boxes) in the second half of the month. This type of pattern can be seen at market tops. It starts with a gap-up (shown by the green circle) and ends with an exhaustion gap (shown by the red circle). You can click this chart to see a full-size version.
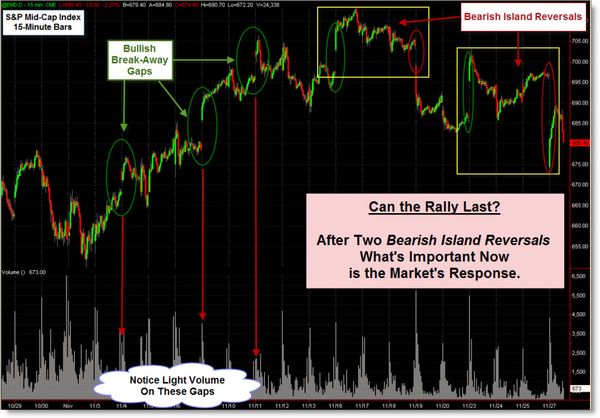
To understand what this pattern shows, you can think of it as the last buyers
rushing to get in (pushing-up price so fast that it creates a
break-away gap), only to find that there are no new buyers (causing a
price drop and the resulting exhaustion gap). This gap down can signal
the beginning of a change in trend. Two of them in a row makes me more watchful.
David Corna reminded me that this pattern shows-up differently on a higher time-frame. For example, on a daily candlestick chart, the intra-day Island Reversal manifests as two classic reversal patterns, a Hanging Man followed by an Evening Star. Their very names are onomatopoetic to their meaning. These candlestick formations will almost always be found at the end of a trend and the beginning of a reversal.
Chart.ly from StockTwits is a Good Source of Ideas.
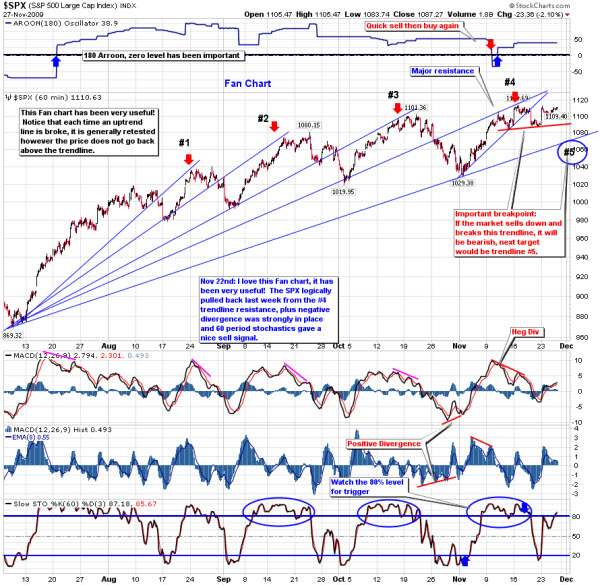
Many traders use charts and technical analysis to gain insight and perspective on what's happening in the markets. I'm always looking for resources that help me do that. Recently, I've found a lot of good content on the Chart.ly website. It is part of StockTwits, and has a strong user community. Here is an example of a chart I found there this week.
I like the analysis, and concur that the bottom trend-line (and the area on the far right of the chart marked by the blue circle) points to a key price area. Staying above that is important for the rally to continue.
How bullish has the rally been in real economic terms?
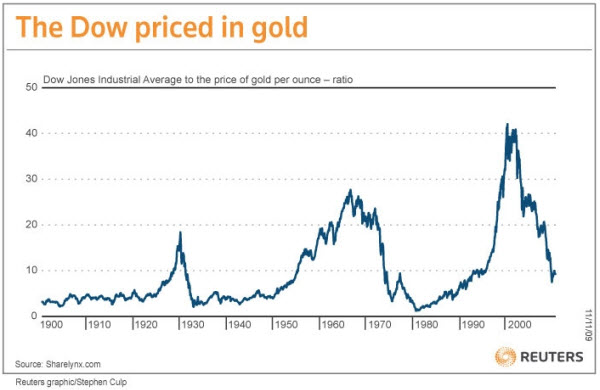
What the Dow Priced in Gold Tells You?
This chart shows the Dow Jones Industrial Average priced in Gold. In other words, how many ounces of gold does it take to buy the Dow's price? So, for example, when the Dow is at 10,000 and Gold is $1,000 per ounce, it would take 10 ounces.
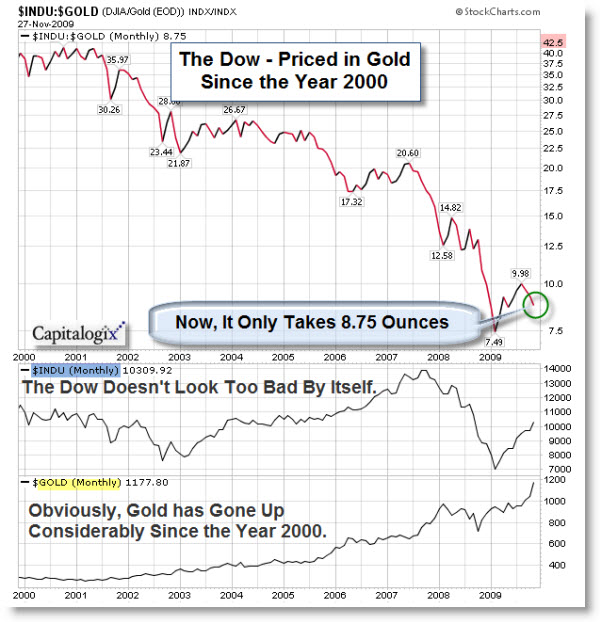
Here is a similar chart, limited to the past ten years.
As you can see, it took over 40 ounces of Gold to pay for Dow in early 2000. It now takes around 8.75 ounces. From this perspective, it looks like the Dow lost 80% of its value. That seems significant, even though the Dow's price is back close to the levels traded in the year 2000.
I don't normally put too much stock in charts that show one asset priced in another. If it was supposed to be priced that way, it would be … However, this comparison seems more relevant to me because gold is a form or currency. Also, as people decide what to invest in lost opportunity cost is a factor.
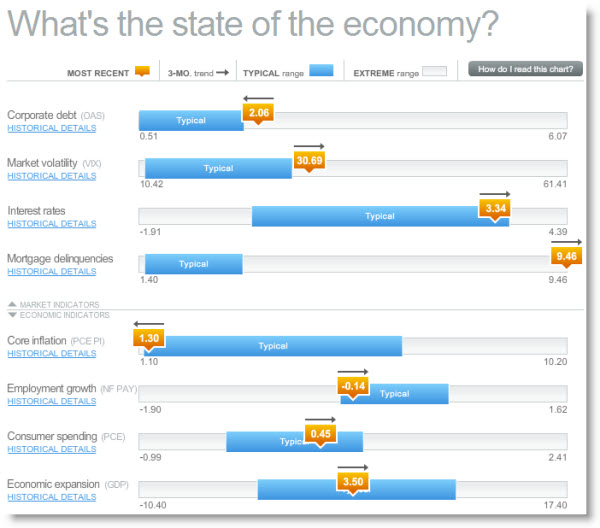
How is the Economy Doing?
Here is a chart from Russell Investments that identifies a few key economic and market indicators to help assess the current economic health and trend. Click the chart for an interactive version.
Business Posts Moving the Markets that I Found Interesting This Week:
- Reasons Gold Is Rallying … (Jesse's Café)
- A Good Old-Fashioned Panic & Not Just in Our Equity Markets. (Macro-Man)
- Stating the Obvious: Why the Stock Market Should Crash. (Of Two Minds)
- Kass: Is it Time to Anticipate a Reversal of Fortune? (TheStreet)
- NBC-Comcast Move Closer to Deal. (TDB)
- Betting on Bytes: is IT Rebound a Sign that the Economy's Improving? (Economist)
- More Posts Moving the Markets.
Lighter Ideas and Fun Links that I Found Interesting This Week
- Alpha Males Must Trade on More than Machismo. (FT)
- America's Healthiest and Unhealthiest States. (MSN Health)
- In Tough Economy, Tighter Belts Mean Thicker Waists. (WSJ)
- Man in ‘Coma’ Heard Everything for 23 years. (MSNBC)
- Clicker's Online TV & Movie Guide Impresses. (Newser)
- Answers to 15 More Google Interview Questions that Will Make You Feel Stupid. (Insider)
- More Posts with Lighter Ideas and Fun Links.

Thank you for putting such great effort into your article, week in and week out.