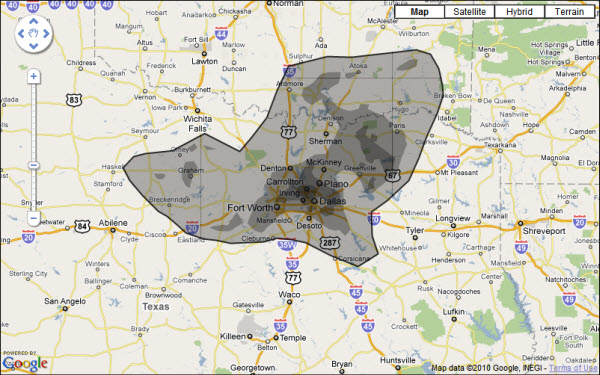
Here is a picture that puts things in perspective. It overlays a representation of how big the oil spill is, now, over a map of where you live. Since I live in the Dallas-Fort Worth area, here is the result. Try it yourself by clicking the graphic.
The disaster in the Gulf started with an explosion on the BP operated Deepwater Horizon oil rig on April 20, 2010. Current estimates put the amount of oil being discharged from the broken well at above 1,050,000 US gallons per day. No one ever said cleaning up an oil spill was cheap: the U.S. government served BP with a hefty $69 million bill for the initial costs of contending with the worst oil disaster in U.S. history. Here is a link to a site devoted to the spill and its fallout.
Reading about it is one thing … However, seeing what is happening is often a better way to gauge reality. So judge for yourself; here is a live stream from an under-water "Spill-Cam".
It comes from PBS.


![Reblog this post [with Zemanta]](http://img.zemanta.com/reblog_c.png?x-id=97b3a39f-6455-4649-86b0-ffac919dc6f3)
Disaster. Very sad.
Obama says ready to “kick ass” over Gulf oil spill
Perhaps, now is too late…
http://www.viewheadlines.com/News/Article.aspx?i=7546