It's almost summer.
So, the winter hibernation period is officially over.
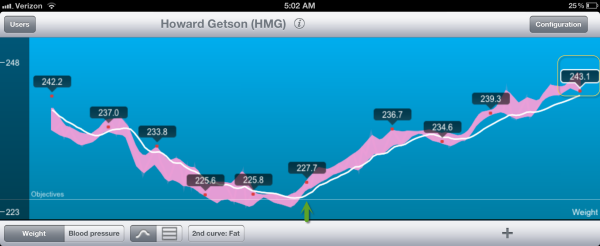
However, I noticed a disturbing trend (at least for me). Here's a picture showing how my weight has fluctuated for the past year. I wonder why?
The chart is interesting for a couple of reasons. The first is that the data is plotted automatically using a Withings scale. It's wireless, and once you set it up, all you have to do is stand on the scale, and it does the rest for you. It also links to various fitness tracking sites (like Fitbit). It is very convenient.
The Big Bull Market in My Ass.
Everything appeared to be going well until November. At that point, the trend changed and my weight began climbing a wall of worry.
Until Jen and I took a trip to Asia last November, we had been going to the gym, running in the park, and using a personal trainer. The chart tells the rest of the story.
Did I gain weight because I stopped going to Delano (the personal trainer)? … was it because I stopped running? … or was it Seasonal Affect Disorder ("SAD")? Nope, the only thing "sad" is how few of my skinny pants still fit.
This chart is somewhat like a market chart. It's easy to attribute causes to something that was really only coincident. Going to Asia didn't cause my laziness. My time off from personal training was a symptom rather than the cause.
Ultimately, it doesn't really matter why something happened, what matters is what you choose to do now.
Hmm … sounds like the first lesson of trend trading. Click here for more.


