With Facebook's IPO set to happen soon, I was thinking about some of the other big tech IPOs.
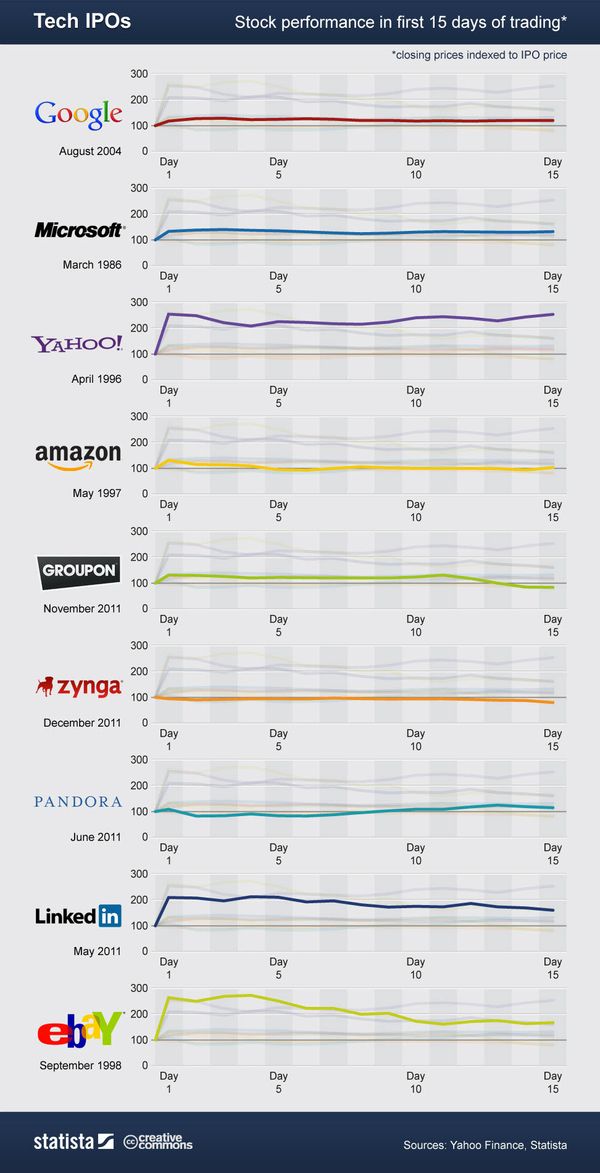
The first few weeks of trading may not be a good estimate of how successful a company will be over time. The charts below, from a Mashable post showing how nine tech giants did after going public, highlight that point.
First, here is a normalized index chart showing the initial 15 days of trading for each company.
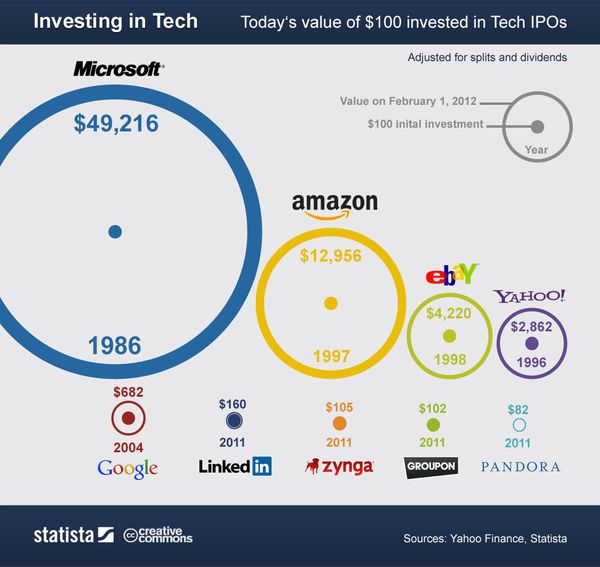
Second, here is a chart showing growth to date. This chart illustrates how much a $100 investment, at the IPO price, would be worth today.
Some of those returns are surprising, aren't they?


Hi Howard, thanks for the info. Looks like Microsoft and Amazon is going strong with their trading.
Thanks Howard. I dont think so, as you can see facebook is going down in continously so its a bit risky to try