- From May 1 through October 31 seasonality is unfavorable, and the market most often finishes lower than it was at the beginning of the period.
- The period from November 1 through April 30 is seasonally favorable, and the market most often finishes the period higher.
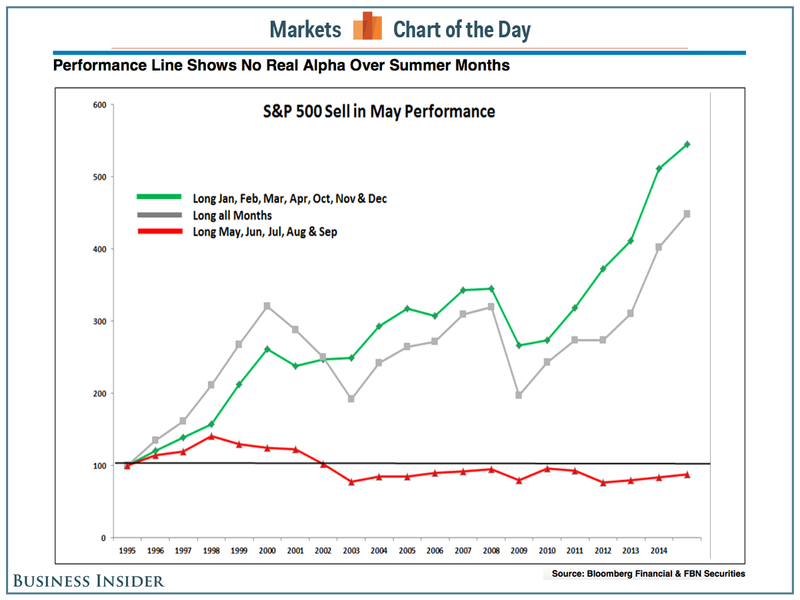
Here is a recent chart showing the returns, for the past 20 years, of this Halloween through April bullish seasonality idea.

via Business Insider.
Superficially, it seems to work … a little.
While the statistical average results for these two periods are quite compelling, trying to ride the market in real-time in hopes of capturing these results is not always as easy as it sounds.
Assume that bull and bear market pressures tend to override seasonal tendencies.
So what is happening now?
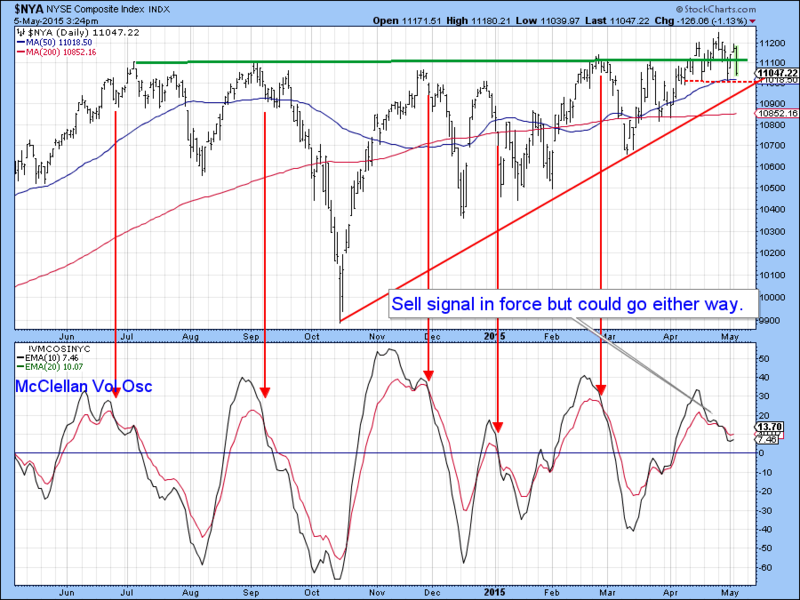
While the NYSE Composite has been doing its best to break to the upside … but it continues to be stuck in a decision zone.
Short-term momentum indicators, like the the McClellan Volume Oscillator, shows slight weakness.
via Stockcharts.com.
The McClellan Volume Oscillator is a barometer of volume … and indicates how overbought/oversold the market is. Direction is most important – because it indicates whether the market is getting stronger (rising) or weaker (falling). The cross-overs are a sign that the trend could be changing. Crossing beneath the zero line is a secondary confirmation.
Recently, it is showing weakness (and recent similar occurrences are marked). Basically, it highlights that price is making highs, but with less momentum.
So, what does it mean?

