As we close the books on September, it's a good time to review some weekly charts.
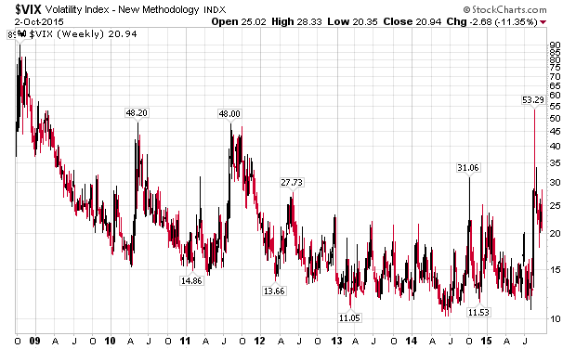
The VIX is regarded as the "Fear Index" by many. Recently, it screamed "Fear" (jumping to levels not seen since the 2008 crash.
However, the alert was short-lived. Things have calmed down quickly (too quickly?).
via stockcharts.com.
Given where we are, perhaps the lack of fear is a sign of potential danger?
The market has been in the midst of a solid correction for the past six weeks; but, so far, the broad stock market indices are testing and holding key levels.
On the other hand, it won't take much to push things over the line — and trigger a lot of selling.
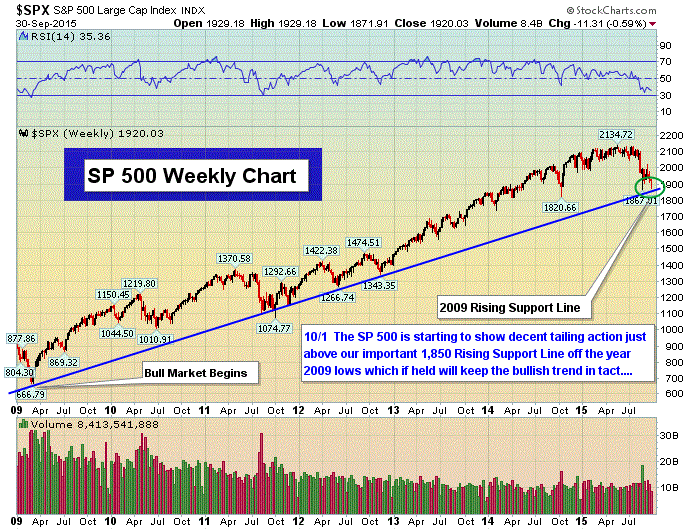
Take a look at the S&P 500 weekly chart, below, which is currently holding at the bullish up-trend support line. Many traders will identify this area as a dividing line between a correction within a continuing bull market and a bear market.
Chart via The Informed Trader, courtesy of Stockcharts.com.
Viewed another way, this is where Bulls will likely try to defend the up-trend.
So, will the market attract buyers … or sellers?
Personally, I expect volatility.
Why?
Because markets exist to trade. And it tends to generate those trades by 'shaking' the weak holders.
A big move up, here, will trigger a lot of buying (and short-covering by weak bears).
While a big move down will trigger a lot of selling (as Bulls fear the long-anticipated next leg down).
With the election in front of us, this is likely the line-in-the-sand to watch.
It wouldn't be surprising if the battle raged here (for a bit) before resolving.


