Fit or Fat? Data Says … "Fatter than Ever".
It’s no secret that the US has a weight problem, but did you realize how fast the country got fat?
The U.S. has gone from a relatively thin country to a place where the norm in many areas is to be overweight or even obese.
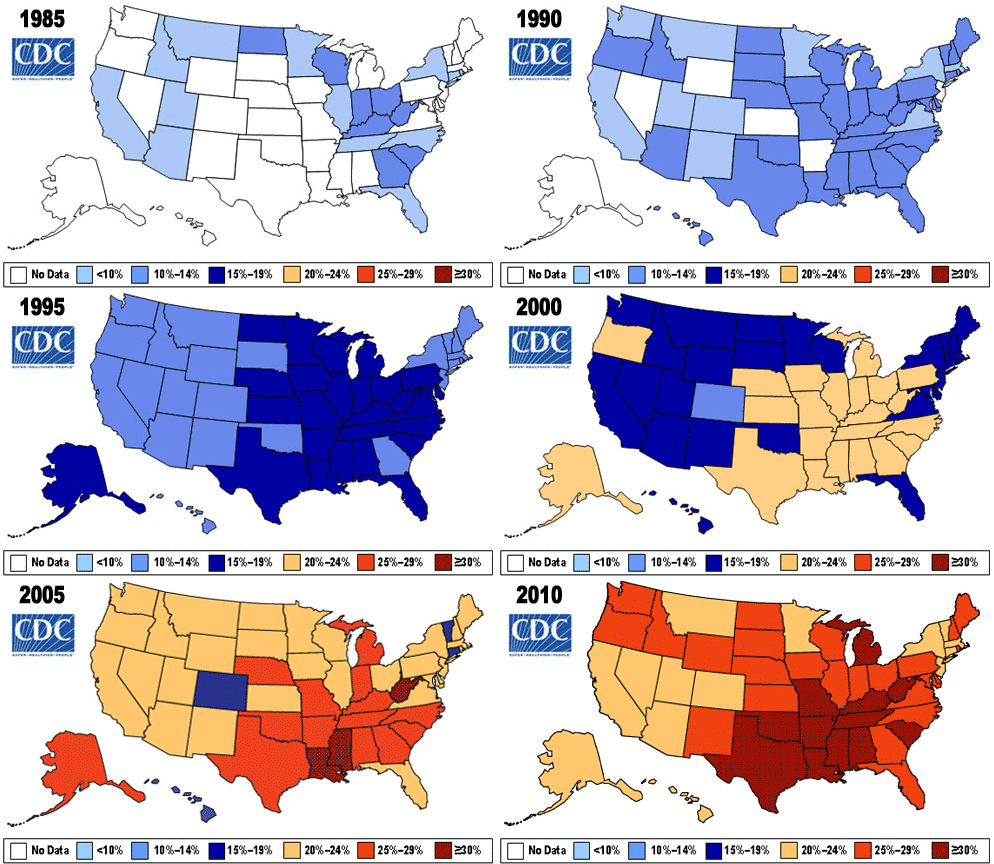
Look How Fast It Happened. The chart starts in 1985.

via The Atlantic
This animated map is jaw-dropping (or belt-busting). Notice the how the
rate of change accelerates when it reaches the 2000s … many states
burst from around a 20% obesity level to over 30%.
It is interesting to note that Colorado remains the only state (in blue) with less than 20% obesity.
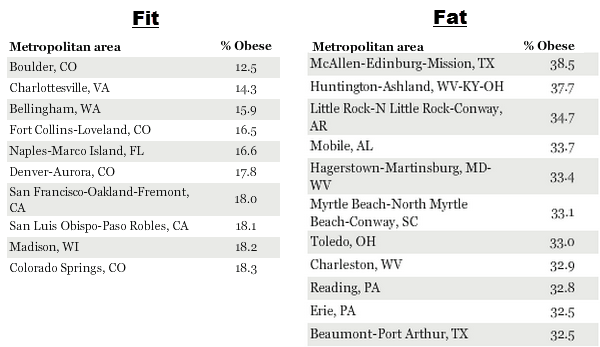
Meanwhile, Gallop recently released their
Well-Being Index of 189 metro areas. In 2012, obesity
rates in all but two areas were above 15%.
Here are the Fittest and Fattest Communities in the U.S.:
If you live in Charlottesville VA or Boulder CO, you’re probably looking good.


